Strategi Perdagangan Garis Tren Kemiringan Dinamis
Ringkasan
Gagasan inti dari strategi ini adalah menggunakan kemiringan dinamis untuk menentukan arah tren harga dan menghasilkan sinyal perdagangan yang digabungkan dengan penilaian terobosan. Secara khusus, ini akan melacak harga tinggi dan rendah baru secara real-time, menghitung kemiringan dinamis berdasarkan perubahan harga dalam periode waktu yang berbeda, dan kemudian menggabungkan harga untuk menilai terobosan garis tren.
Prinsip Strategi
Strategi ini terdiri dari beberapa langkah utama:
Menentukan harga tertinggi dan terendah: melacak harga tertinggi dan terendah dalam periode tertentu (misalnya 20 garis K) untuk menentukan apakah itu tinggi atau rendah baru
Hitung Slip Dinamis: Mencatat jumlah garis K yang tinggi atau rendah, menghitung Slip Dinamis dari titik tinggi dan rendah setelah periode tertentu (seperti 9 garis K)
Menggambar garis tren: Menggambar garis tren naik dan turun berdasarkan kemiringan yang dinamis
Perpanjangan dan pembaruan garis tren: garis tren diperpanjang dan diperbarui saat harga menembus garis tren
Sinyal perdagangan: kombinasi harga dengan garis tren, penilaian sinyal over dan short
Keunggulan Strategis
Strategi ini memiliki keuntungan sebagai berikut:
Bergerak dalam menentukan arah tren, fleksibel dalam menanggapi perubahan pasar
Mengontrol Stop Loss, Pengembalian Kecil
Sinyal-sinyal terobosan yang jelas dan mudah diterapkan
Parameter yang dapat disesuaikan, beradaptasi
Struktur kode yang jelas, mudah dipahami dan digunakan kembali
Risiko dan Solusi
Strategi ini juga memiliki beberapa risiko:
Pada saat tren bergejolak, lebih banyak kepala kosong, disarankan untuk menambahkan kondisi filter.
Mungkin lebih banyak sinyal palsu yang dapat ditembus, parameter dapat disesuaikan atau kondisi penyaringan dapat ditambahkan
Stop loss risiko dapat ditingkatkan jika terjadi perubahan yang drastis
Ruang optimasi terbatas, kemampuan untuk menghasilkan keuntungan terbatas, cocok untuk perdagangan garis pendek
Arah optimasi
Strategi ini dapat dioptimalkan untuk:
Menambahkan indikator teknis untuk menilai sinyal filter
Mengoptimalkan kombinasi parameter, mencari parameter terbaik
Mencoba untuk memperbaiki strategi stop loss dan mengurangi risiko
Menambahkan fungsi untuk menyesuaikan amplitudo input secara otomatis
Mencoba untuk mencari peluang lebih dalam kombinasi dengan strategi lain
Meringkaskan
Strategi ini secara keseluruhan adalah strategi short-line yang efisien berdasarkan kecenderungan penilaian kecenderungan dan pemecahan perdagangan berdasarkan kecenderungan yang dinamis. Strategi ini menilai dengan akurat, risiko dapat dikendalikan, dan cocok untuk digunakan untuk menangkap peluang short-line di pasar. Dengan lebih mengoptimalkan parameter dan menambahkan kondisi filter, Anda dapat meningkatkan tingkat kemenangan dan keuntungan dari strategi tersebut.
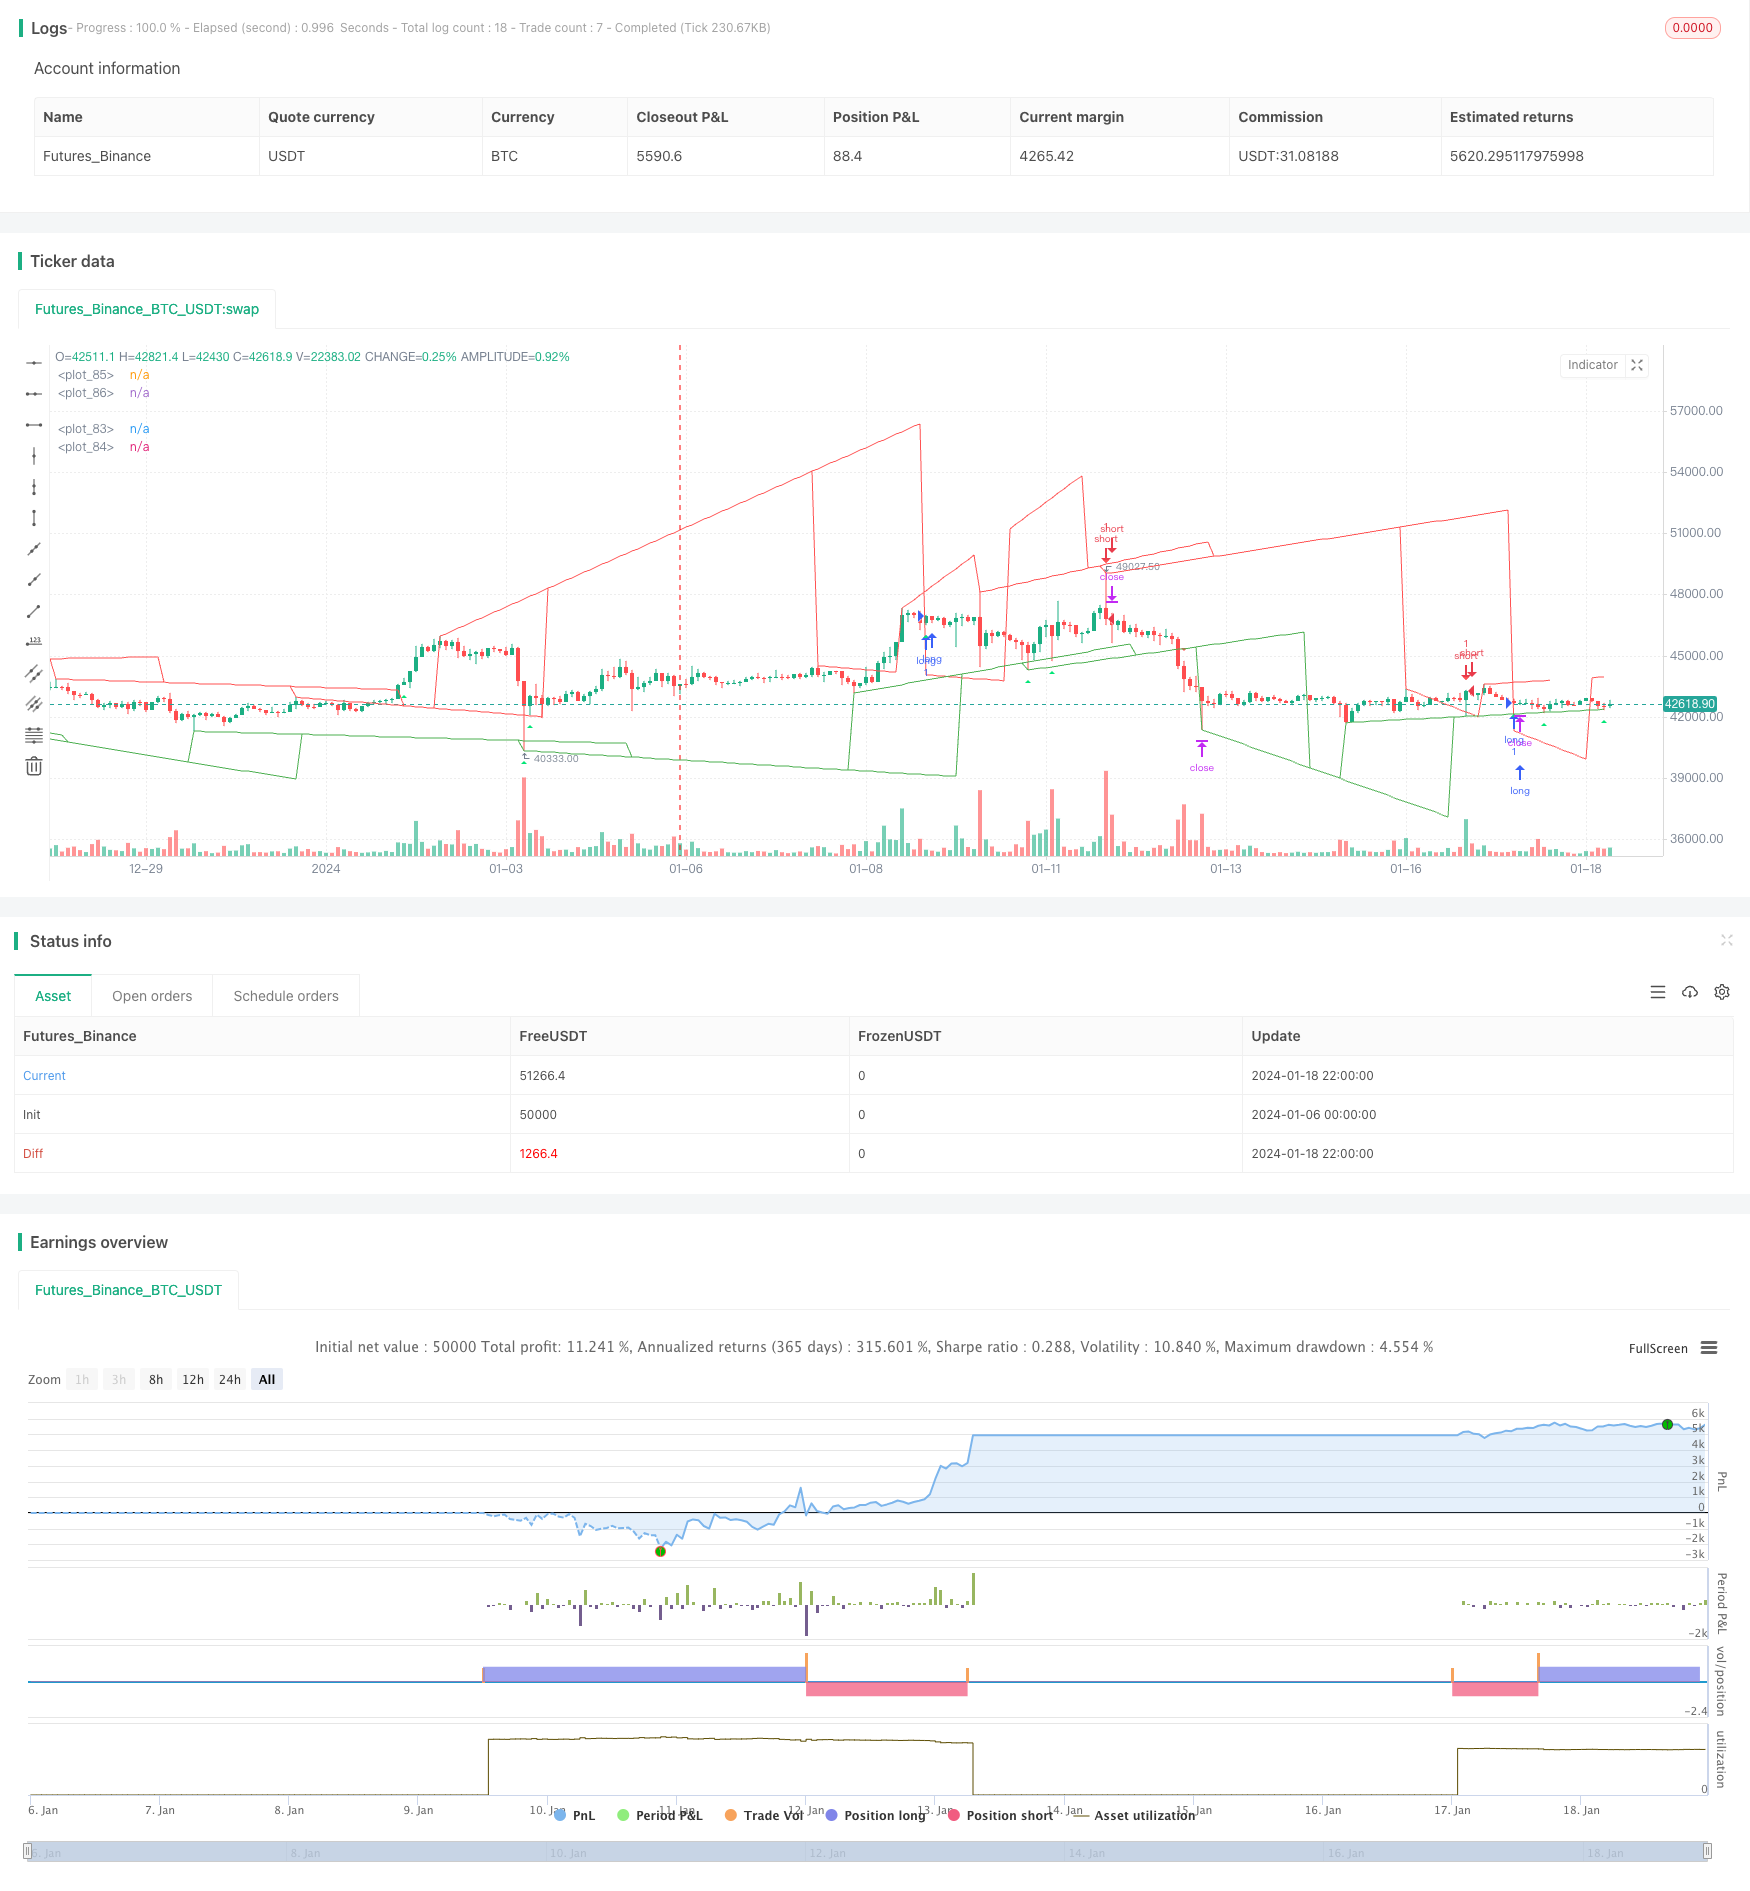
/*backtest
start: 2024-01-06 00:00:00
end: 2024-01-19 00:00:00
period: 2h
basePeriod: 15m
exchanges: [{"eid":"Futures_Binance","currency":"BTC_USDT"}]
*/

// This source code is subject to the terms of the Mozilla Public License 2.0 at https://mozilla.org/MPL/2.0/
// © pune3tghai

//Originally posted by matsu_bitmex

//tried adding alerts on plots and cleared the chart for a cleaner view.
//Publishing the script in hope of getting it improved by someone else.

//Added strategy code for easier calculations

//Needs work on TP and SL part.

//P.S - THE ORIGINAL CODE IS MUCH BETTER BUT I have tried to be more usable and understandable.

//@version=4
strategy("TrendLines with Alerts", overlay=true)     //study("TrendLines with Alerts", overlay=true)
//update

length1 = input(20)
check = input(9)
//length2 = input(200)


u=0.0
u := u[1]

l=0.0
l := l[1]

y=0.0
y := y[1]

yl=0.0
yl := yl[1]

angle = 0.0
angle := angle[1]

anglel = 0.0
anglel := anglel[1]

if (highest(length1) == high[check] and highest(length1) == highest(length1)[check] and barssince(barstate.isfirst) > check)
    u := high[check]


if (lowest(length1) == low[check] and lowest(length1) == lowest(length1)[check] and barssince(barstate.isfirst) > check)
    l := low[check]


p = round(barssince(u == high[check]))

pl = round(barssince(l == low[check]))

if p == 0 and barssince(barstate.isfirst) > check
    y := high[abs(p[1]+1+check)]

if pl == 0 and barssince(barstate.isfirst) > check
    yl := low[abs(pl[1]+1+check)]


if p == 0
    angle := (u-y)/p[1]

if pl == 0
    anglel := (l-yl)/pl[1]

uppertrend = u+ (p * angle)

lowertrend = l+ (pl * anglel)

extendup = if barssince(barstate.isfirst) > check
    uppertrend[check] + angle[check] * check*2

extenddown = if barssince(barstate.isfirst) > check
    lowertrend[check] + anglel[check] * check*2


//plot(l[offset]-u,color=red)
//plot(u[offset]-l,color = green )
plot(lowertrend, color = color.green, transp=30,offset = -check)
plot(extenddown, color = color.green, transp=100)
plot(uppertrend, color = color.red, transp=30, offset = -check)
plot(extendup, color = color.red, transp=100)
//plot(l[offset], color = red)

l1 = lowertrend
l2 = extenddown
u1 = uppertrend
u2 = extendup


l2sell = crossunder(high, l2)
u2buy = crossover(low, u2)
buy1 = (low<=lowertrend) and open>lowertrend and high>lowertrend and close>lowertrend
buy2 = (low<=extenddown) and open>extenddown and high>extenddown and close>extenddown
buy = buy1 or buy2 or u2buy
plotshape(series=buy, title="Buy", style=shape.triangleup, size=size.tiny, color=color.lime, location=location.belowbar)
sell1 = (high>=uppertrend) and open<uppertrend and low<uppertrend and close<uppertrend
sell2 = (high>=extendup) and open<extendup and low<extendup and close<extendup
sell = sell1 or sell2 or l2sell
plotshape(series=sell, title="Sell", style=shape.triangledown, size=size.tiny, color=color.red, location=location.abovebar)

longCond = buy
shortCond = sell

tp = input(0.2, title="Take Profit")

tpbuyval = valuewhen(buy, close, 1) + (tp/100)*(valuewhen(buy, close, 1))
tpsellval = valuewhen(sell, close, 1) - (tp/100)*(valuewhen(sell, close, 1))


sl = input(0.2, title="Stop Loss")
slbuyval = valuewhen(buy, close, 0) - (sl/100)*(valuewhen(buy, close, 0))
slsellval = valuewhen(sell, close, 0) + (sl/100)*(valuewhen(sell, close, 0))
// === STRATEGY ===
tradeType = input("BOTH", title="What trades should be taken : ", options=["LONG", "SHORT", "BOTH", "NONE"])

// stop loss
slPoints = input(defval=0, title="Initial Stop Loss Points (zero to disable)", minval=0)
tpPoints = input(defval=0, title="Initial Target Profit Points (zero for disable)", minval=0)

//>>>>>>>>>>>>>>>>>>>>>>>>>>>>>>>>>>>>>>>>>>>>>>>>>>>>>>>>>>>>>>>>>>>>>>>>>>>>>//

testStartYear = input(2019, "Backtest Start Year", minval=1980)
testStartMonth = input(1, "Backtest Start Month", minval=1, maxval=12)
testStartDay = input(1, "Backtest Start Day", minval=1, maxval=31)
testPeriodStart = timestamp(testStartYear, testStartMonth, testStartDay, 0, 0)

testStopYear = input(9999, "Backtest Stop Year", minval=1980)
testStopMonth = input(12, "Backtest Stop Month", minval=1, maxval=12)
testStopDay = input(31, "Backtest Stop Day", minval=1, maxval=31)
testPeriodStop = timestamp(testStopYear, testStopMonth, testStopDay, 0, 0)

testPeriod() =>
    time >= testPeriodStart and time <= testPeriodStop ? true : false

//<<<<<<<<<<<<<<<<<<<<<<<<<<<<<<<<<<<<<<<<<<<<<<<<<<<<<<<<<<<<<<<<<<<<<<<<<<<<<//

//
//set up exit parameters
TP = tpPoints > 0 ? tpPoints : na
SL = slPoints > 0 ? slPoints : na

// Make sure we are within the bar range, Set up entries and exit conditions
if testPeriod() and tradeType != "NONE"
    strategy.entry("long", strategy.long, when=longCond == true and tradeType != "SHORT")
    strategy.entry("short", strategy.short, when=shortCond == true and tradeType != "LONG")
    strategy.close("long", when=shortCond == true and tradeType == "LONG")
    strategy.close("short", when=longCond == true and tradeType == "SHORT")
    strategy.exit("XL", from_entry="long", profit=tpbuyval, loss=slbuyval)
    strategy.exit("XS", from_entry="short", profit=tpsellval, loss=slsellval)

// === /STRATEGY ===
//EOF


////ALERT SYNTEX
//alertcondition(longCond, title="Long", message="Killer Market")
//alertcondition(shortCond, title="Short", message="Poopy Market")