ボリンガー+RSI,ダブル戦略 v1.1
作者: リン・ハーンチャオチャン開催日:2022年5月7日 14:59:50タグ:RSI
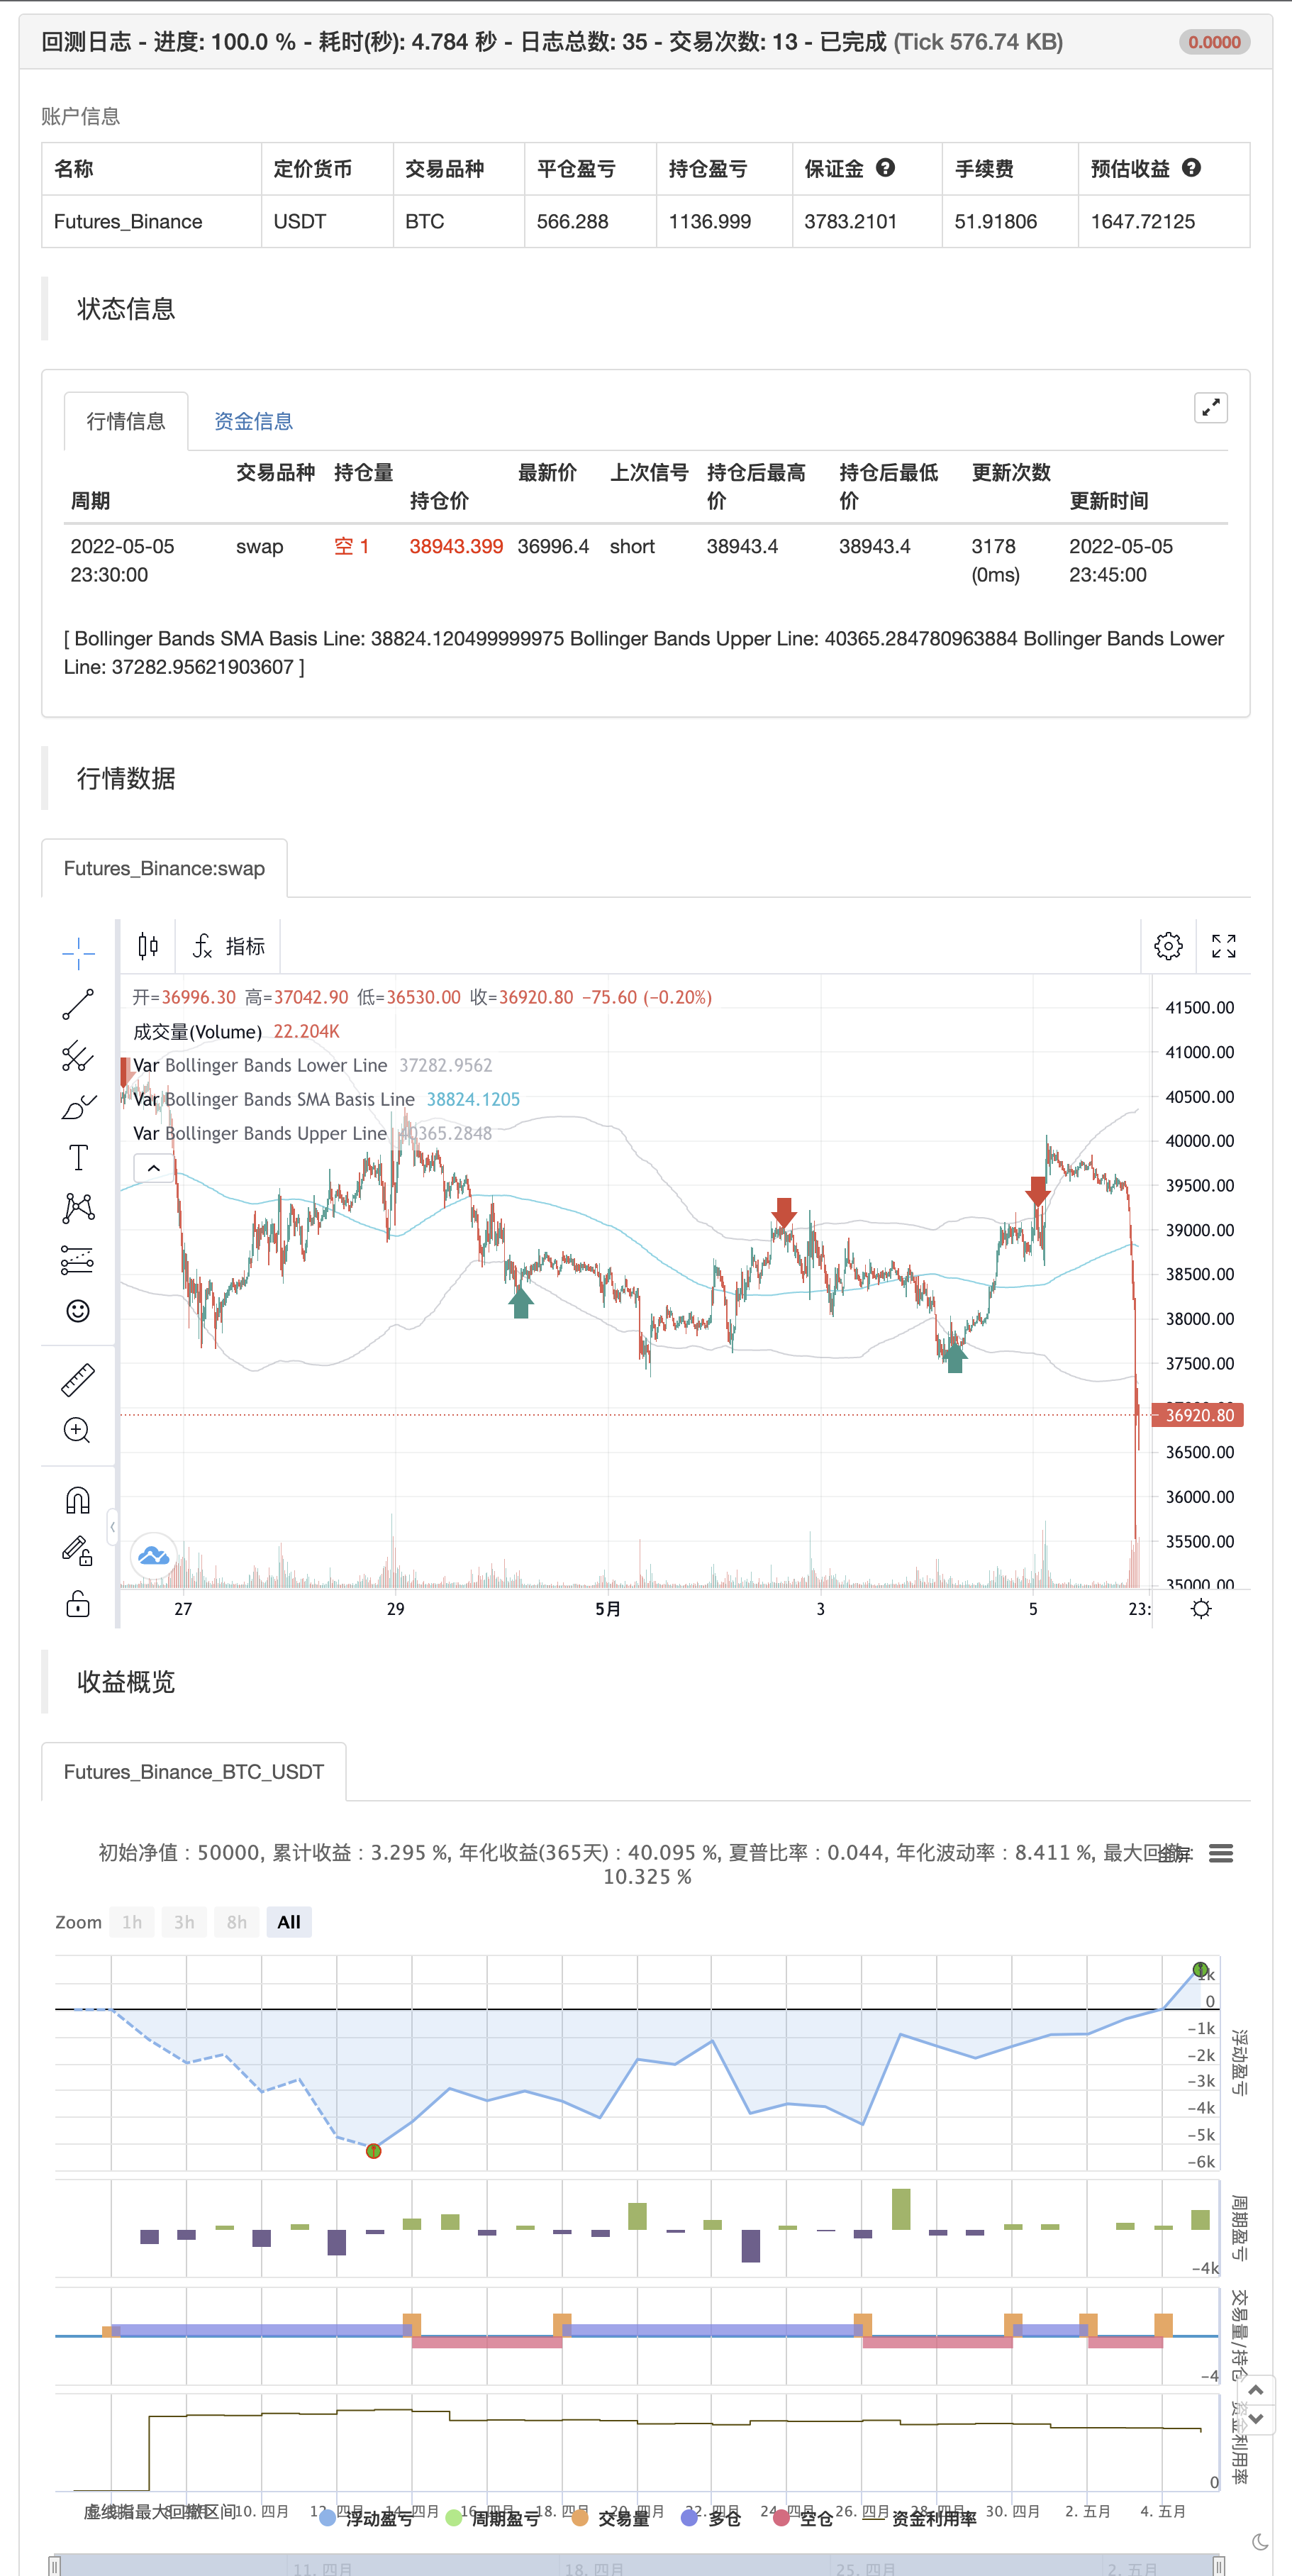
この戦略は,RSIインジケーターとボリンジャーバンドを組み合わせて,価格が上位ボリンジャーバンドを超えるときに売却 (そしてこの値が下位ボリンジャーバンド以下のときに購入) する.この単純な戦略は,RSIとボリンジャーバンドインジケーターの両方が同時に過買いまたは過売り状態にある場合にのみ起動する.
アップデートこの更新版1.1では,この戦略はユーザー向けに簡素化され (インプットが少なく),現在,ボリンジャーバンドの基礎となるSMAの200期を使用することでバックテストにおいてより成功しました.
この戦略は,最初のバージョンと同様に,より高いタイムフレームから閉じる価格を使用せず,現在のキャンドルが閉じた後に再塗装してはならない.現在のキャンドルが閉まっていない間,すべてのトレディングビューインジケーターのように再塗装される可能性があります.
すべての取引には高いリスクが伴う.過去のパフォーマンスは必ずしも将来の結果を示すものではない.仮説的またはシミュレーションされたパフォーマンスの結果は,特定の固有の制限があります.実際のパフォーマンス記録とは異なり,シミュレーションされた結果は実際の取引を表現しません.また,取引が実際に実行されていないため,結果は,流動性の欠如などの特定の市場の要因の影響のために,または過剰に補償されている可能性があります.シミュレーションされた取引プログラムは,一般的に,後見の利益のために設計されているという事実にも従います.いかなるアカウントも,示されたものと同様の利益や損失を達成するか,または達成する可能性が高いことを表現していません.
この戦略スクリプトのより多くの機能にアクセスしたい場合は,バージョン1.0を使用してください:復習する
/*backtest
start: 2022-04-06 00:00:00
end: 2022-05-05 23:59:00
period: 15m
basePeriod: 5m
exchanges: [{"eid":"Futures_Binance","currency":"BTC_USDT"}]
*/

//@version=2
strategy("Bollinger + RSI, Double Strategy (by ChartArt) v1.1", shorttitle="CA_-_RSI_Bol_Strat_1.1", overlay=true)

// ChartArt's RSI + Bollinger Bands, Double Strategy - Update
//
// Version 1.1
// Idea by ChartArt on January 18, 2015.
//
// This strategy uses the RSI indicator
// together with the Bollinger Bands
// to sell when the price is above the
// upper Bollinger Band (and to buy when
// this value is below the lower band).
//
// This simple strategy only triggers when
// both the RSI and the Bollinger Bands
// indicators are at the same time in
// a overbought or oversold condition.
//
// In this version 1.1 the strategy was
// both simplified for the user and
// made more successful in backtesting.
//
// List of my work:
// https://www.tradingview.com/u/ChartArt/
//
//  __             __  ___       __  ___
// /  ` |__|  /\  |__)  |   /\  |__)  |
// \__, |  | /~~\ |  \  |  /~~\ |  \  |
//
//


///////////// RSI
RSIlength = input(6,title="RSI Period Length")
RSIoverSold = 50
RSIoverBought = 50
price = close
vrsi = rsi(price, RSIlength)


///////////// Bollinger Bands
BBlength = input(200, minval=1,title="Bollinger Period Length")
BBmult = 2 // input(2.0, minval=0.001, maxval=50,title="Bollinger Bands Standard Deviation")
BBbasis = sma(price, BBlength)
BBdev = BBmult * stdev(price, BBlength)
BBupper = BBbasis + BBdev
BBlower = BBbasis - BBdev
source = close
buyEntry = crossover(source, BBlower)
sellEntry = crossunder(source, BBupper)
plot(BBbasis, color=aqua,title="Bollinger Bands SMA Basis Line")
p1 = plot(BBupper, color=silver,title="Bollinger Bands Upper Line")
p2 = plot(BBlower, color=silver,title="Bollinger Bands Lower Line")
//fill(p1, p2)


///////////// Colors
switch1=input(true, title="Enable Bar Color?")
switch2=input(true, title="Enable Background Color?")
TrendColor = RSIoverBought and (price[1] > BBupper and price < BBupper) and BBbasis < BBbasis[1] ? red : RSIoverSold and (price[1] < BBlower and price > BBlower) and BBbasis > BBbasis[1] ? green : na
///barcolor(switch1?TrendColor:na)
//bgcolor(switch2?TrendColor:na,transp=50)


///////////// RSI + Bollinger Bands Strategy
if (not na(vrsi))

    if (crossover(vrsi, RSIoverSold) and crossover(source, BBlower))
        strategy.entry("RSI_BB_L", strategy.long, stop=BBlower,  comment="RSI_BB_L")

    if (crossunder(vrsi, RSIoverBought) and crossunder(source, BBupper))
        strategy.entry("RSI_BB_S", strategy.short, stop=BBupper,  comment="RSI_BB_S")

//plot(strategy.equity, title="equity", color=red, linewidth=2, style=areabr)
関連性
- MACD RSI イチモク・モメンタム・トレンド 長期戦略に続く
- RSIの方向転換戦略
- 強化されたボリンガー帯のRSI取引戦略
- ピボットとモメンタム戦略
- 移動平均値とRSIの包括的な取引戦略
- ターンオーバー火曜日の戦略 (週末フィルター)
- RSI/MACD/ATRとの強化されたEMAクロスオーバー戦略
- MACD と RSI の組み合わせた長期取引戦略
- RSI2 ストラテジー 日中の逆転 勝利率 バックテスト
- 戦略をフォローする多指標の傾向
- AlphaTradingBotの取引戦略
もっと
- 多粒のバゲット
- ミルマシーン
- Kの逆転指標 I
- 飲み込める ろうそく
- MA 皇帝 インシリコノット
- デマルクの逆転点
- スイング・ハイス/ローズ&キャンドル・パターン
- TMA オーバーレイ
- MACD + SMA 200 戦略
- CM スリングショットシステム
- ボリンジャー・バンド戦略
- オプティマイズされたトレンドトラッカー
- パインスクリプト戦略における月間リターン
- v4 の ADX と DI
- MacD カスタム インディケーター - 多重タイムフレーム+すべてのオプション!
- インディケーター: WaveTrend オシレーター
- 圧縮モメント インディケーター
- アルファトレンド
- 複数のタイムフレーム取引
- 感情オシレーター