オープンブラケット高価格クロス取引戦略

概要
この戦略は,開値と高値の交差による取引信号判断を行う.開値の上で高値の穿越をすると多し,開値の下に高値の穿越をすると空きをする.移動平均を使用することで価格データを平らにし,取引のノイズを減らす.移動平均のタイプとパラメータを構成することができる.また,トラッキングストップを有効に設定して利益をロックするかどうかを構成することができる.
戦略原則
-
代替周期解析度 ((useRes) を使用するかどうかを入力パラメータに基づいて決定する.使用する場合はstratResに基づいて周期を設定する.
-
入力パラメータに基づいて移動平均を使用するかどうかを決定する ((useMA) 。使用する場合は,basisTypeに基づいて移動平均のタイプを選択し,basisLenは周期長さを設定する。
-
オープン価格 ((open) とクローズ価格 ((close)) の一連のデータを取得します.移動平均を使用する場合,選択した移動平均のタイプとパラメータのスムーズ処理を適用します.
-
現在の開値xと開値シリーズopenSeriesを比較する。xがopenSeriesより大きい場合はトレンドステートは多頭,そうでない場合は空頭である。
-
値上がり時に多信号 longCond,値下がり時に空調信号 shortCondを生成する.
-
多頭または空頭ポジションに多頭または空頭ポジションに移動する. 追跡ストップが有効である場合は,ストップポイント位置と偏移距離を設定する.
戦略的優位性
-
オープン価格と高価格の2つの異なるシリーズを使用して取引信号判断を行い,単一のデータシリーズの制限を回避する.
-
移動平均の技術は,短期市場のノイズをフィルタリングし,主要トレンドをロックします.
-
移動平均の種類を柔軟に設定し,パラメータを最適に調整できます.
-
トラッキング・ストップを使用してリスクをコントロールし,利益をロックするかどうかを選択できます.
-
戦略の最適化スペースは広く,異なる品種と市場環境に対応してパラメータの調整が可能である.
戦略リスク
-
単一の取引信号源,信号が稀で,シールが漏れやすい.
-
移動平均は後退し,短期的な機会を逃す可能性があります.
-
追跡停止の設定が不適切で,早すぎたり,大きすぎたりする可能性があります.
-
パラメータを正しく設定しない場合,仮想取引が頻繁になり,実際の取引の効果が損なわれる可能性があります.
-
異なる品種と市場環境によってパラメータを調整する必要があり,最適化が困難である.
-
他の指標判断を追加したり,機械学習モデルを導入したりして信号源を豊かにすることができる.移動平均のタイプとパラメータを最適の平滑効果に調整する.慎重にストップポイントを設定し,より多くの利益を得るために適切に放宽する.十分なフィットバックを施して,パラメータを信頼できるように最適化する.
戦略最適化の方向性
-
ブリン・バンド,KDなどの技術指標の判断を加え,取引信号を豊かにする.
-
信号判断を処理する機械学習モデルを適用する.
-
移動平均のパラメータを最適化して,最適なパラメータの組み合わせを見つけます.
-
ストップ・ロスのパラメータを最適化して,ストップ・ロスの幅と利益の獲得をバランスさせる.
-
パラメータ最適化機能が追加され,最適なパラメータを自動的に検索する.
-
各種種に特有のパラメータテンプレートを開発する.
-
定量化フィードバックフレームワークの開発,急速な代入戦略.
要約する
この戦略は,開値と高値の交差を基に取引信号判断を行い,移動平均技術のフィルターノイズを使用する.パラメータを柔軟に配置し,複数の効果を実現する.一定の利点があるが,信号の少量,滞りなどいくつかの問題もある.より多くの指標の組み合わせ判断,機械学習方法などの導入によって最適化され,より強力な取引戦略を形成することができる.異なる品種と市場環境に応じてパラメータ調整を最適化して,最適な効果を達成する必要がある.
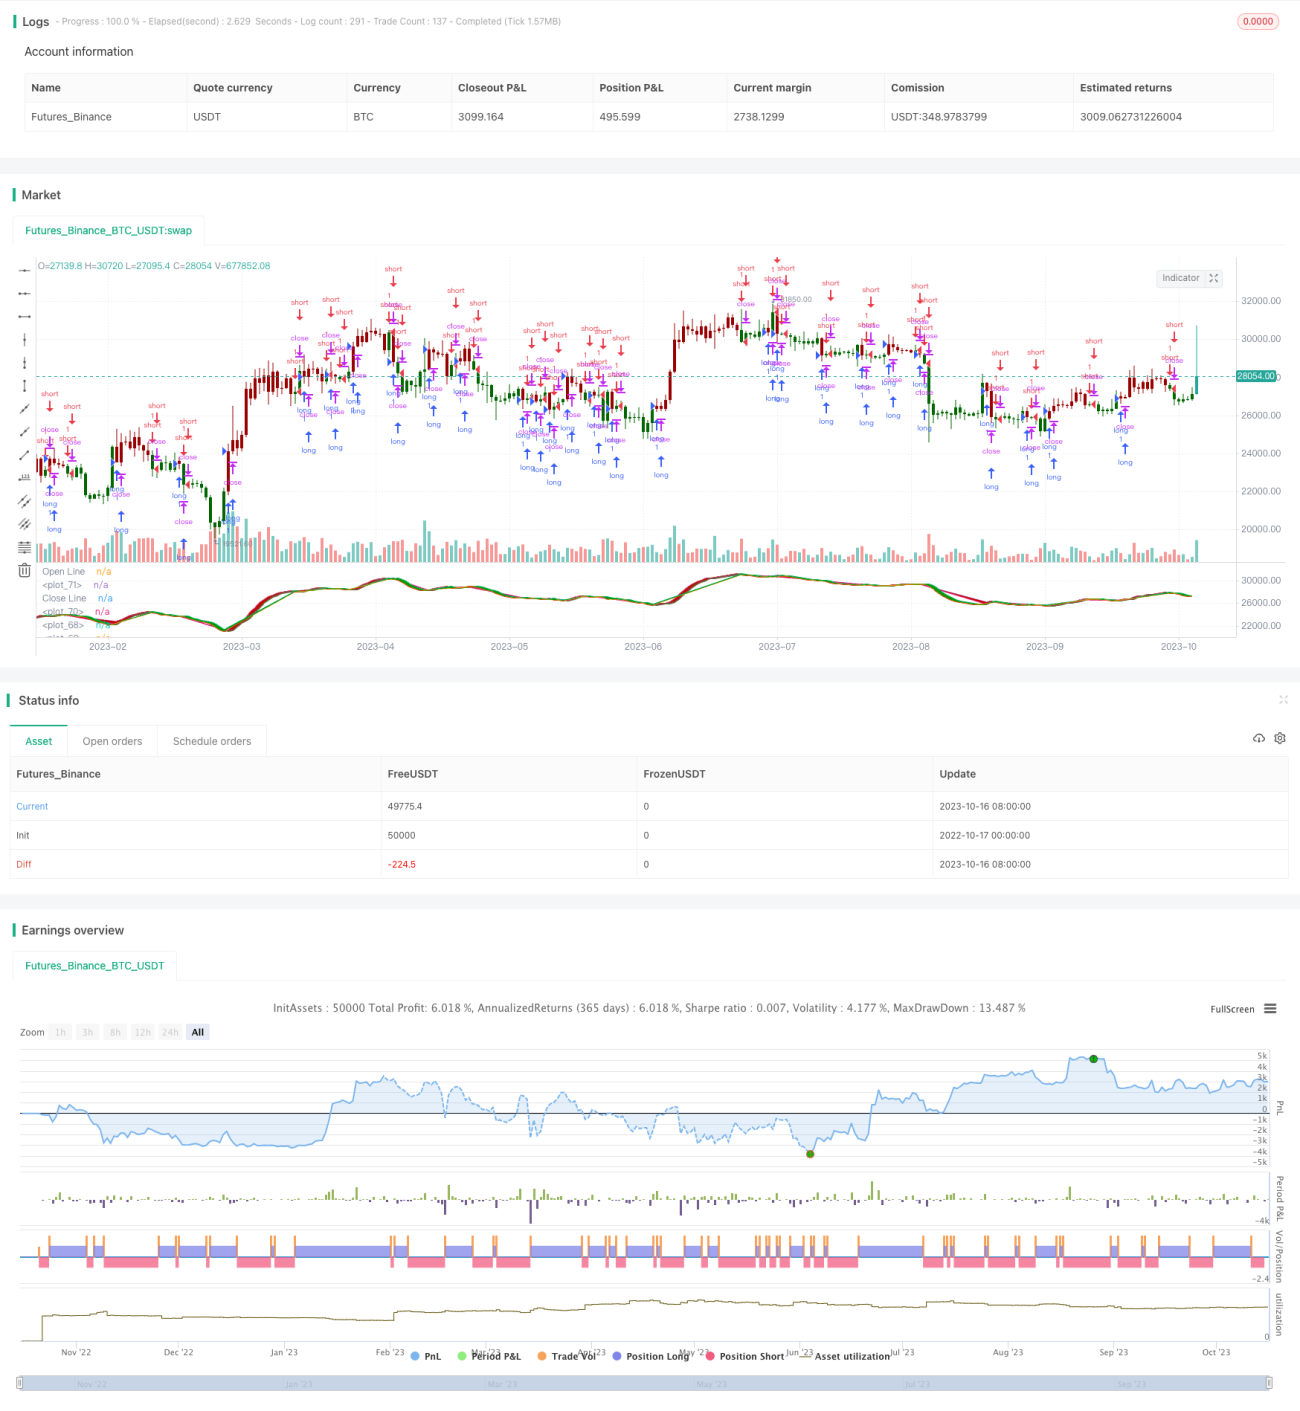
/*backtest
start: 2022-10-17 00:00:00
end: 2023-10-17 00:00:00
period: 1d
basePeriod: 1h
exchanges: [{"eid":"Futures_Binance","currency":"BTC_USDT"}]
*/

//@version=2

//strategy(title = "Open Close Cross Strategy", shorttitle = "OCC Strategy", overlay = true, pyramiding = 0, default_qty_type = strategy.percent_of_equity, default_qty_value = 10)
- 1