累積ブレイクアウト取引戦略


作成日: 2023-10-25 17:34:41 最終変更日: 2023-10-25 17:34:41
コピー: 1 クリック数: 739
1
フォロー
1617
フォロワー

累積ブレイクアウト取引戦略

概要

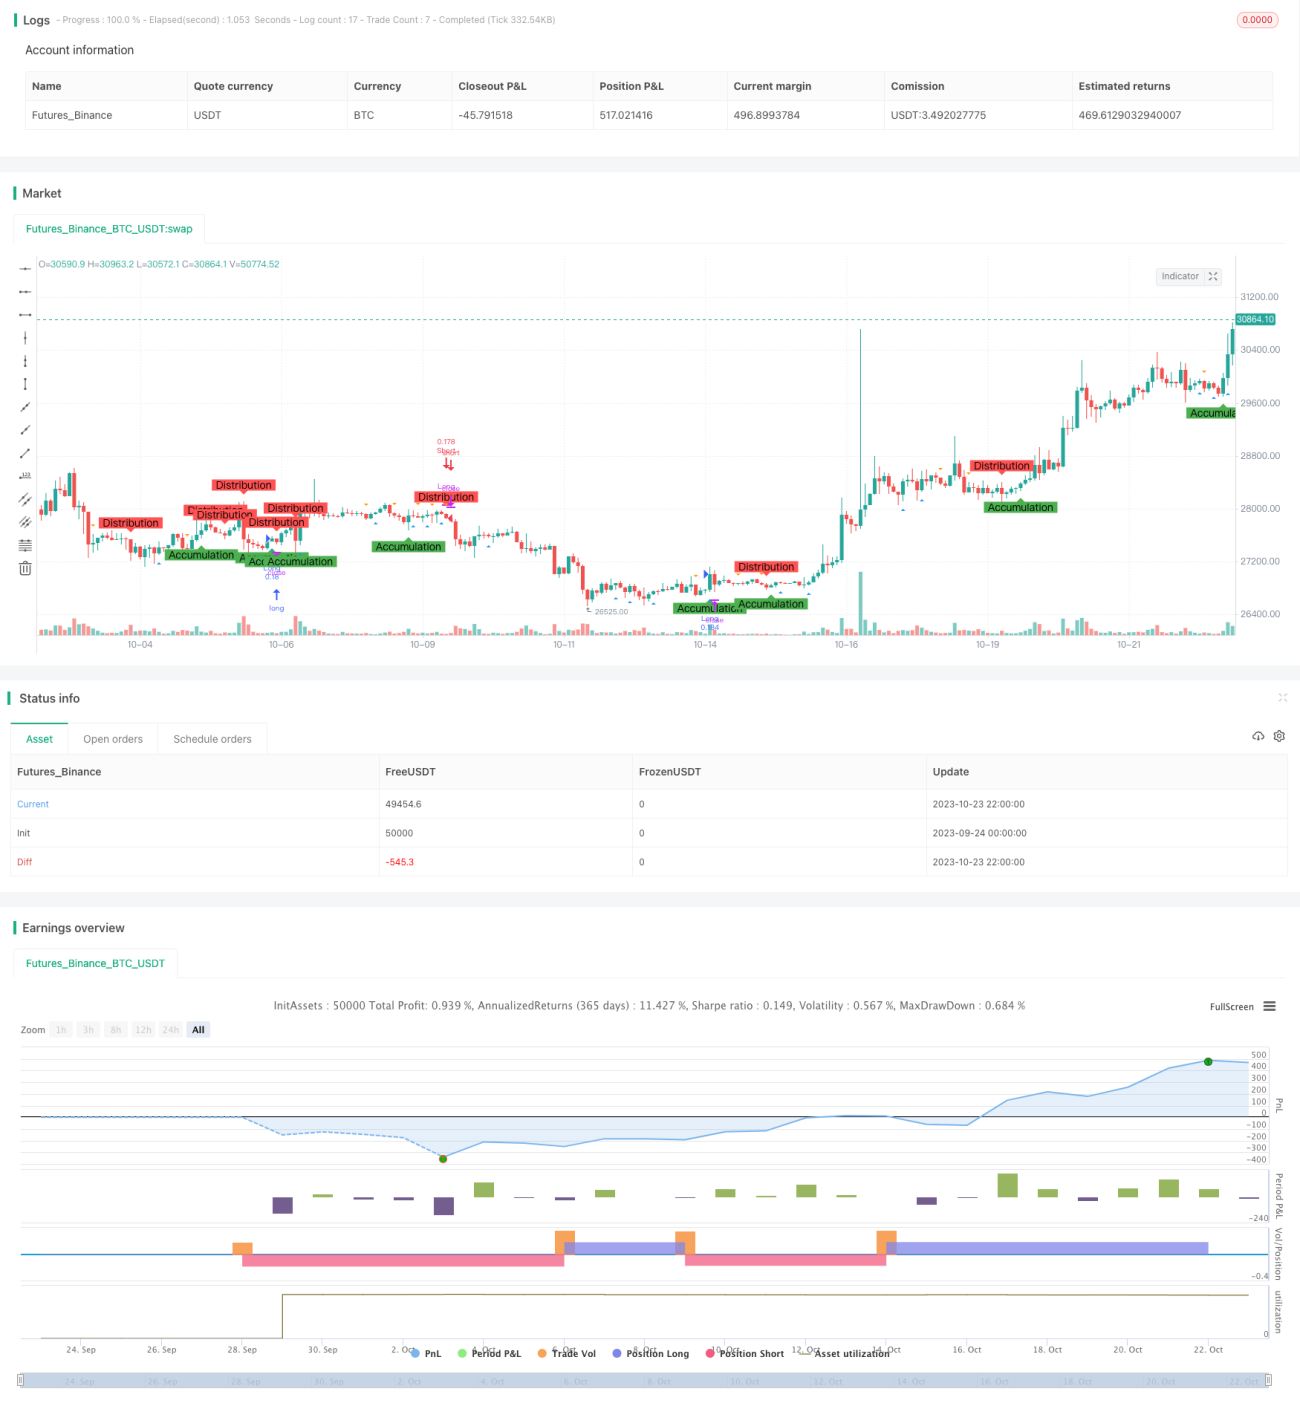
漸層突破取引戦略は,市場の漸層と分配の段階を識別し,矢印形状と反転形状の判断を補助したビクトル分析の原理を採用し,潜在的な買入と売却の機会を探します.

戦略原則

  1. 累積と分配の段階を識別するために,異なる長さの平均線を交差する. 終盤価格の上で長さがAccumulationLengthの平均線を穿ったとき,累積段階として判断する. 終盤価格の下の長さがDistributionLengthの平均線を穿ったとき,分配段階として判断する.

  2. 異なる長さの均線交差を用いて弾弓形と反転形を識別する.低点に長さがSpringLengthの均線を穿ったとき,弾弓形と判断する.高点の下に長さがUpthrustLengthの均線を穿ったとき,反転形と判断する.

  3. 漸進段階では弾弓形を観察すると,多行;分配段階では反転形を観察すると,空行.

  4. ストップレベルを設定します. 長いポジションのストップは閉店価格の ((1 - ストップのパーセント%),短いポジションのストップは閉店価格の ((1 + ストップのパーセント%)).

  5. グラフに漸進期,分配期,弾弓形状と反転形状をマークして,形状の識別を容易にする.

優位分析

  1. ビクトル分析法を使用して,市場勢力の漸進と分配の段階を識別することで,取引信号の信頼性を向上させることができる.

  2. 弾弓形と反転形を組み合わせて取引を行うことで,取引信号をさらに検証できます.

  3. ストップ・ロスは,単一損失を効果的に制御します.

  4. グラフに記号をつけると,蓄勢形成の全過程をはっきりと見ることができます.

  5. この戦略のパラメータは調整可能で,異なる市場と取引サイクルに最適化できます.

リスク分析

  1. 聚合行情により均線信号が誤信号を発する可能性があります.

  2. 弾弓形と反転形は失効する可能性があります.

  3. ストップダスの破綻により損失が増加する可能性があります.

  4. 異なる市場に対応するパラメータの調整が必要で,不適切な場合は取引シグナルエラーを引き起こす可能性がある.

  5. 機械取引システムは,回路の時間には柔軟性がないため,人工監視が必要になる可能性があります.

最適化の方向

  1. 異なる市場で異なる周期でパラメータの最適な組み合わせをテストできます.

  2. 取引信号の確認には,取引量要素を追加することを考慮することができます.

  3. ダイナミックストップを設定し,市場の変動に応じてストップレベルを調整できます.

  4. 重要なタイミングで誤った取引を避けるために,基本要素の追加も考えられます.

  5. 機械学習アルゴリズムに動的に最適化パラメータを組み込むことができる.

要約する

累積突破取引戦略は,ビクトル分析,均線指標,形状認識などの複数の技術分析方法を統合し,市場勢いを効果的に識別し,取引信号を生成することができる.この戦略は,信頼できる取引信号,制御可能なリスク,明確な視覚表示などの利点がある.しかし,機械的な取引システムとして,復路時間とパラメータの適応性は改善される必要があります.将来の最適化の方向は,パラメータパッケージの最適化,取引量確認,損失停止の最適化,重要な基本要素の組み込みなどにあります.全体的に,この戦略は,日中のショートライン取引のための効果的な意思決定支援を提供します.

ストラテジーソースコード
/*backtest
start: 2023-09-24 00:00:00
end: 2023-10-24 00:00:00
period: 2h
basePeriod: 15m
exchanges: [{"eid":"Futures_Binance","currency":"BTC_USDT"}]
*/

// This source code is subject to the terms of the Mozilla Public License 2.0 at https://mozilla.org/MPL/2.0/
// © deperp

//@version=5
strategy("Wyckoff Range Strategy",  overlay=true, initial_capital=1000, default_qty_type=strategy.percent_of_equity, default_qty_value=10, commission_type=strategy.commission.percent)

// Input Variables
AccumulationLength = input(32, "Accumulation")
DistributionLength = input(35, "Distribution")
SpringLength = input(10, "Spring")
UpthrustLength = input(20, "Upthrust")
stopPercentage = input(10, "Stop Percentage")

// Accumulation Phase
isAccumulation = ta.crossover(close, ta.sma(close, AccumulationLength))

// Distribution Phase
isDistribution = ta.crossunder(close, ta.sma(close, DistributionLength))

// Spring and Upthrust
isSpring = ta.crossover(low, ta.sma(low, SpringLength))
isUpthrust = ta.crossunder(high, ta.sma(high, UpthrustLength))

// Strategy Conditions
enterLong = isAccumulation and isSpring
exitLong = isDistribution and isUpthrust

enterShort = isDistribution and isUpthrust
exitShort = isAccumulation and isSpring

// Entry and Exit Conditions
if (enterLong)
    strategy.entry("Long", strategy.long)
    
if (exitLong)
    strategy.close("Long")

if (enterShort)
    strategy.entry("Short", strategy.short)

if (exitShort)
    strategy.close("Short")

// Stop Loss
stopLossLevelLong = close * (1 - stopPercentage / 100)
stopLossLevelShort = close * (1 + stopPercentage / 100)
strategy.exit("Stop Loss Long", "Long", stop=stopLossLevelLong)
strategy.exit("Stop Loss Short", "Short", stop=stopLossLevelShort)

// Plotting Wyckoff Schematics
plotshape(isAccumulation, title="Accumulation Phase", location=location.belowbar, color=color.green, style=shape.labelup, text="Accumulation")
plotshape(isDistribution, title="Distribution Phase", location=location.abovebar, color=color.red, style=shape.labeldown, text="Distribution")
plotshape(isSpring, title="Spring", location=location.belowbar, color=color.blue, style=shape.triangleup)
plotshape(isUpthrust, title="Upthrust", location=location.abovebar, color=color.orange, style=shape.triangledown)