1-3-1 赤と緑のKライン反転戦略

概要
1-3-1 紅緑K線反転戦略は,K線形状に基づいて買入シグナルを判断する戦略である.この戦略は,1つの赤いK線が3つの緑のK線によって反転されているかどうかを観察して買入の機会を探している.
原則
この戦略の核心的な論理は:
- 現在のK線が赤のK線であるかどうかを判断します.
- 3つのK線が緑のK線であるかどうかを判断します.
- 緑のK線の1つ目のK線が2つ目のK線よりも高いかを判断します.
- 上記の条件を満たす場合,赤のK線が終了する時に市場価格で購入します.
- ストップは赤のKラインの最低値に設定します.
- ストップは,入場価格と入場価格からストップ価格までの距離で設定されます.
この戦略により,赤K線が反転したときに購入することができます. 傾向が上昇する可能性が高いからです. リスクを管理し,利益をロックするために,ストップとストップを設定します.
優位分析
1-3-1 赤い緑のK線反転戦略には以下の利点があります.
- 戦略の論理はシンプルで明快で,理解し,実行しやすい.
- K線形特性を利用し,いかなる指標にも依存せず,過度に最適化によって生じる問題を回避する
- 客観的に実行できる 明確な出入りルールがある
- ストップとストップを設定し,各取引のリスク/リターン比率を制御します.
- テスト結果は良好で,リッドディスクの調整の可能性は高い.
リスク分析
この戦略にはいくつかのリスクがあります.
- K線形は,将来の傾向を100%予測できないので,一定の不確実性がある.
- 株の特異性により,勝率が低い場合
- 大株の動きを考慮せずに,大株が継続的に下落すると,リスクが高い.
- 取引費用とスライドポイントを設定せずに,リールディスクの効果は劣る可能性があります.
対策として
- 平均線などの指標のフィルタリング信号を組み合わせることで,購入の成功率を向上させることができます.
- 倉庫管理の調整,倉庫の建設
- 大幅の状況に応じてストップ・ロスを動的に調整するか,取引を一時停止する
- 異なるストップ・ストップ比率の設定をテストする
- 取引コストを付加した実盤効果をテスト
最適化の方向
この戦略は以下の点で最適化できます.
-
大盘指数に基づくフィルタリング.大盘の短期および中期トレンドに基づいて取引信号をフィルタリングし,大盘が上昇すると購入し,大盘が低下すると取引を停止することができます.
-
取引量の確認を考慮する. 緑のK線の取引量に対する判断を増やす. 取引量が大きくなった場合にのみ購入する.
-
停止停止比率を最適化する.異なる停止停止比率をテストして,最適なパラメータの組み合わせを見つける.動的停止または移動停止を設定することもできます.
-
ポジション管理の最適化. ポジションは,条件が満たされたときに,後日追加され,単一取引のリスクを低減することができる.
-
平均線,波動率などの指標を考慮して,トレンドがより明確になると購入することを保証します.
-
ビッグデータトレーニングは,最適なパラメータを探します.大量の歴史的データを収集し,機械学習などの技術を使用して最適なパラメータの<unk>値を訓練します.
要約する
1-3-1 紅緑K線反転戦略は,全体として,シンプルで実用的なショートライン取引戦略である. 明確な入場・退出ルールがあり,反測効果が良好である. いくつかの最適化措置によって,その实体効果を向上させ,信頼できる量化取引戦略にすることができる. 同時に,リスク管理に注意し,資金を適切に管理する必要があります.
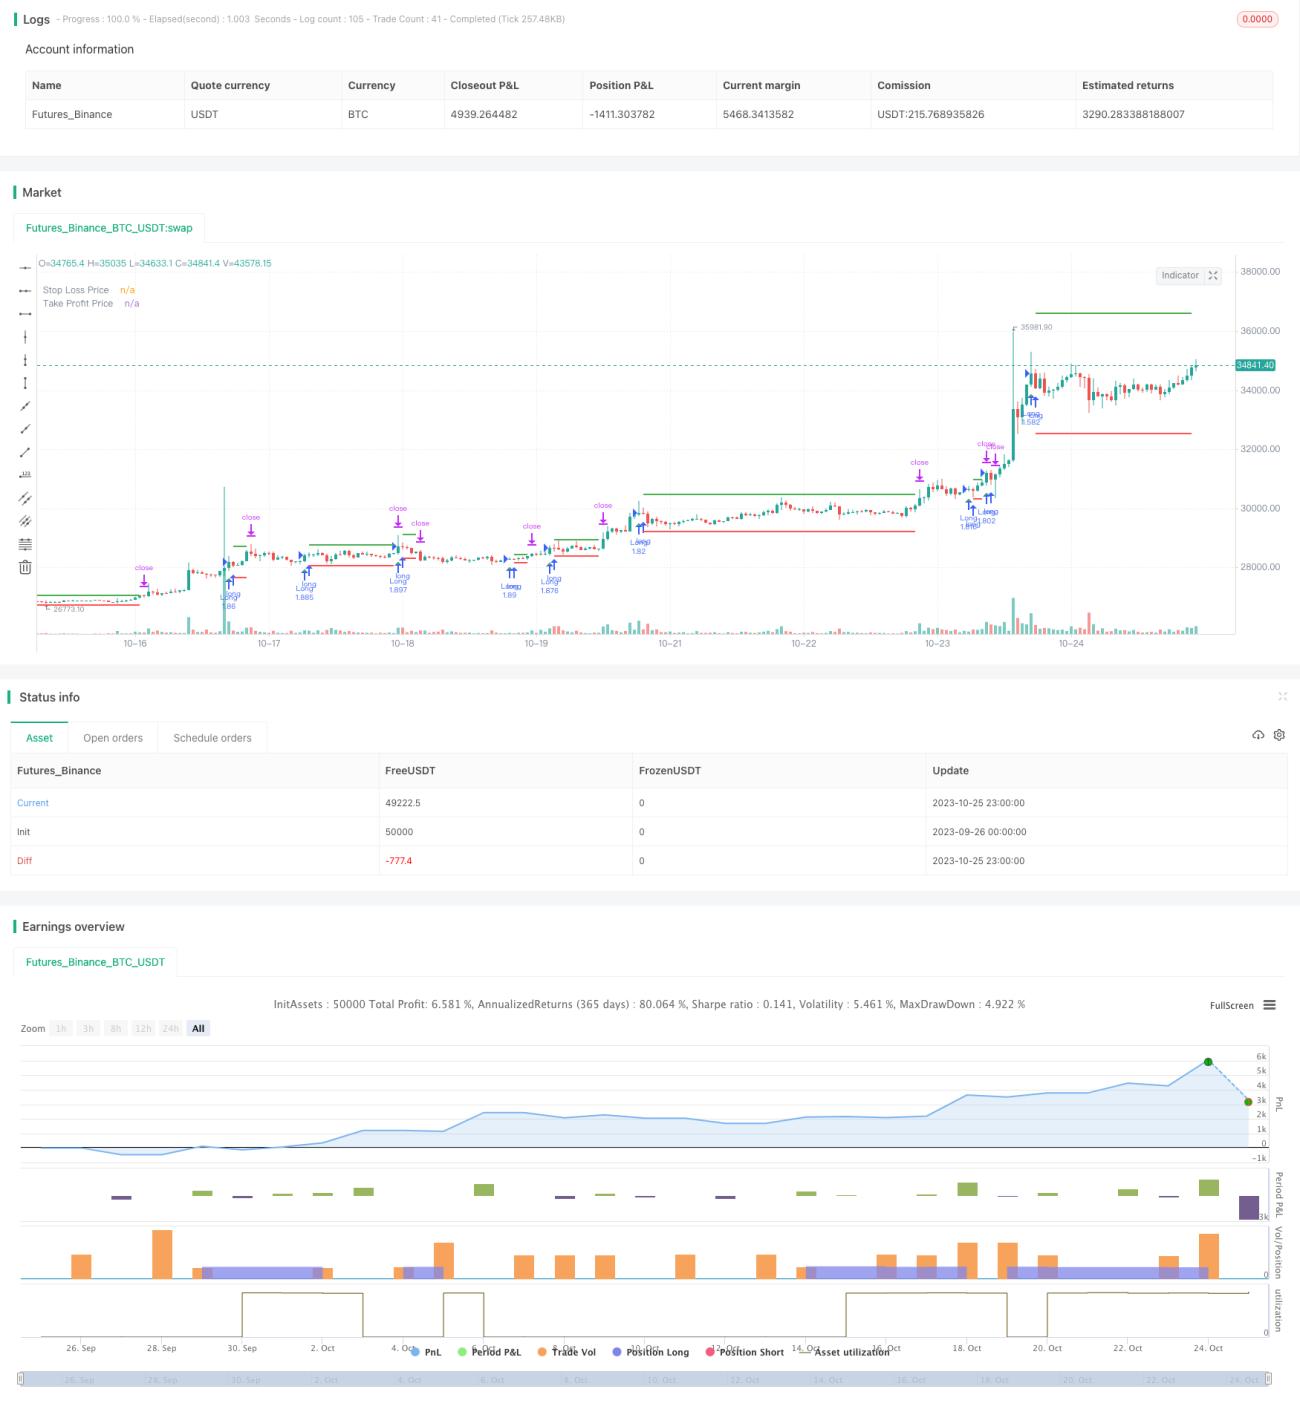
/*backtest
start: 2023-09-26 00:00:00
end: 2023-10-26 00:00:00
period: 1h
basePeriod: 15m
exchanges: [{"eid":"Futures_Binance","currency":"BTC_USDT"}]
*/

//@version=5
//by Genma01
strategy("Stratégie tradosaure 1 Bougie Rouge suivi de 3 Bougies Vertes", overlay=true, default_qty_type = strategy.percent_of_equity,  default_qty_value = 100)
- 1