ブレイクアウト取引戦略


作成日: 2023-10-30 16:58:03 最終変更日: 2023-10-30 16:58:03
コピー: 1 クリック数: 767
1
フォロー
1617
フォロワー

ブレイクアウト取引戦略

概要

突破取引戦略は,市場の波動性の増加によって引き起こされる突破価格を捕捉することを目的としています.この戦略は,平均実際の波動範囲 ((ATR) の指標を使用して,特定の周期内の資産の波動性を測定します.価格がATRによって決定される上下2つの突破ラインを破るとき,多額の多額の信号を発生します.

戦略原則

この戦略は,最初に指定された周期内のATRを計算する. そして,ATRに基づいて上線と下線を計算する. 閉盘価格が上線を突破すると,多行シグナルを生成する. 閉盘価格が下線を突破すると,空白シグナルを生成する. 信号をさらに確認するために,現在のK線形実体部分の閉鎖が必要である.

閉盤価格が上下軌道に突破する際には,突破方向に突破隙の色を記入する.この特性は,現在のトレンド方向を迅速に識別するのに役立ちます.

多額のシグナルが発生し,現在のポジションがないとき,戦略開設多額のシグナルが発生し,現在のポジションがないとき,戦略開設空白.

Lengthパラメータは,波動性の周期長さを測定する.より高いLength値は,より長い価格の波動に注目することを意味する.例えば,Lengthが20である場合,各取引は約100Kラインを横断し,複数の波動を含みます.

長さの値を下げることで,より短期の価格変動に注目し,取引頻度を増やすことができる.長さの値と平均取引長さの間に厳格な対応関係がないため,試行錯誤によって最適な長さの値を見つける必要がある.

優位分析

この戦略は,突破原理を利用して,市場の波動によってもたらされるより大きな状況をつかむことができる.ATR指標は,突破位を動的に計算し,固定パラメータの使用を避ける.

实体K線を用いた確認信号で,偽突破をフィルタリングできる.突破の隙間を埋めると色が直感的にトレンドの方向を示す.

Lengthパラメータは,特定の市場の調整に応じてパラメータを最適化できる,調整戦略の柔軟性を提供します.

リスク分析

突破取引は,値化されるリスクがあります.単一損失を制御するために,ストップを設定できます.

突破信号は誤報が発生し,超短線取引を引き起こす可能性があります.誤報を排除するためにLengthパラメータを適切に調整できます.

パラメータ最適化は,十分な取引データ支持を蓄積する必要があります.初期パラメータの選択が不適切である場合,取引の不良パフォーマンスを引き起こす可能性があります.

最適化の方向

ATR周期内にブリン帯を導入し,新しい突破位計算方法として.ブリン帯突破は誤報率を減らす.

突破後にトレンドを追跡し,すぐに止まることなく続けることができる.例えば,トレンドの付随で止まる.

変動する市場では,異なるパラメータを使用するか,完全に取引しないことを検討して,を避けることができます.

要約する

突破取引戦略は,市場の波動性を利用し,価格が大きな突破が生じるときにトレンドに入る.ATR指標の動態は突破位を決定し,実体K線は偽突破をフィルターする.Lengthパラメータは,戦略周期の調整の柔軟性を提供する.この戦略は,中長期トレンドを追跡するのに適しているが,突破取引のリスクに注意し,パラメータの最適化を行う必要がある.
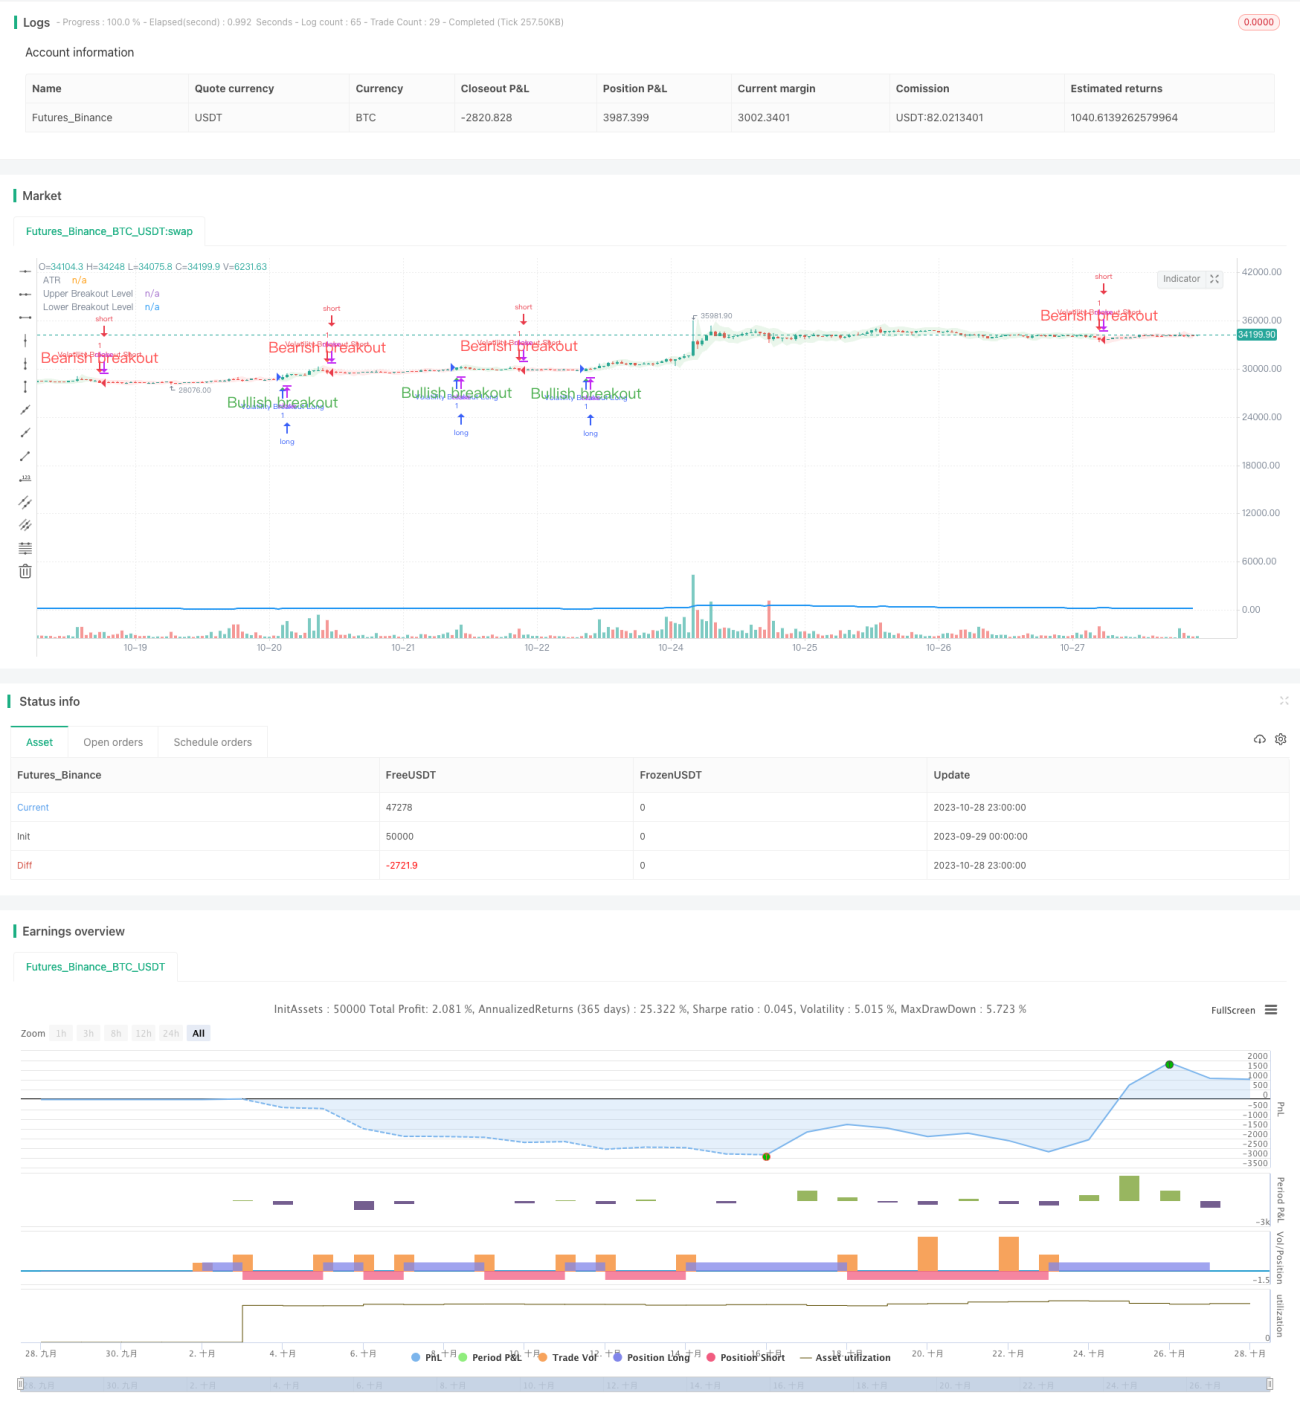
ストラテジーソースコード
/*backtest
start: 2023-09-29 00:00:00
end: 2023-10-29 00:00:00
period: 1h
basePeriod: 15m
exchanges: [{"eid":"Futures_Binance","currency":"BTC_USDT"}]
*/

// This source code is subject to the terms of the Mozilla Public License 2.0 at https://mozilla.org/MPL/2.0/

//@version=5
strategy("Volatility Breakout Strategy [Angel Algo]", overlay = true)

// Inputs
length = input(title="Length", defval=20)

// Calculate the average true range (ATR)
atr = ta.atr(length)

// Plot the ATR on the chart
plot(atr, color=color.blue, linewidth=2, title="ATR")

// Calculate the upper and lower breakouts
upper_breakout = high + atr
lower_breakout = low - atr

// Plot the upper and lower breakouts on the chart
ul = plot(upper_breakout[1], color = color.new(color.green, 100), linewidth=2, title="Upper Breakout Level")
ll = plot(lower_breakout[1], color = color.new(color.red, 100), linewidth=2, title="Lower Breakout Level")

// Create the signals
long_entry = ta.crossover(close, upper_breakout[1]) and barstate.isconfirmed
short_entry = ta.crossunder(close, lower_breakout[1]) and barstate.isconfirmed

active_signal_color =ta.barssince(long_entry) < ta.barssince(short_entry) ? 
   color.new(color.green,85) : color.new(color.red,85)

// Plot the signals on the chart
plotshape(long_entry and ta.barssince(long_entry[1]) > ta.barssince(short_entry[1]), location=location.belowbar, style=shape.triangleup, 
   color=color.green, size=size.normal, text = "Bullish breakout", textcolor = color.green)
plotshape(short_entry and ta.barssince(long_entry[1]) < ta.barssince(short_entry[1]), location=location.abovebar, style=shape.triangledown, 
   color=color.red, size=size.normal,text = "Bearish breakout",  textcolor = color.red)

// Fill the space between the upper and lower levels with the color that indicates the latest signal direction
fill(ul,ll, color=active_signal_color)   

long_condition = long_entry and strategy.position_size <= 0 and barstate.isconfirmed
short_condition = short_entry and strategy.position_size >= 0 and barstate.isconfirmed

if long_condition
    strategy.entry("Volatility Breakout Long", strategy.long)


if short_condition
    strategy.entry("Volatility Breakout Short", strategy.short)