ライオンクラックバランス戦略


作成日: 2023-11-02 16:55:00 最終変更日: 2023-11-02 16:55:00
コピー: 0 クリック数: 586
1
フォロー
1617
フォロワー

ライオンクラックバランス戦略

概要

ライオンの裂け目均衡策略は,均線交差に基づく簡単なショートライン取引策略である.この策略は,主に2つの移動平均を使用し,急速な移動平均が,下から遅い移動平均を横切るとき,多行する.急速な移動平均が,上から遅い移動平均を横切るとき,平行する.この策略の名前は,取引界で流通しているのライオンの裂け目という用語に由来し,ショートライン価格の微細な動きを捉え,狭い均線裂け目から利益を得るという意味である.

戦略原則

この戦略は,2つの移動平均を使用します. 急速移動平均小MAPeriodと遅い移動平均bigMAPeriod. 2つの移動平均は価格チャネルを形成し,チャネルの下は急速移動平均で,チャネル上は遅い移動平均である. 価格が下から上方へ急激に移動するチャネルの下の平均を突破すると,多めに行います.

具体的には,戦略は,まず,速動平均スモールMAと遅動平均ビッグMAを計算する. そして,経路の下沿のバイアードラインのバイアードMAを計算する. これは,遅動平均の ((100 - percentBelowToBuy) %である.

総じて,この戦略は均線の獅子裂け目を捕まえる,すなわち,通路の下沿いを突破して,ショートラインの利益を達成するチャンスである.それは同時に,単一取引のリスクを制御する停止と停止条件を設定している.

優位分析

この戦略の利点は以下の通りです.

  1. 概念はシンプルで,容易に理解し,実行する. 二均線交差を使用することは,最も基本的な技術指標戦略である.

  2. この戦略は,TradingViewの自作の反省機能を使用し,追加的な実装を必要としません.

  3. ビジュアル化が強力である. TradingViewを使用すると,取引シグナルポイントと追溯統計データをチャートに直接表示できます.

  4. リスクはコントロールできます. ストップとストップ・ロスの条件を設定した戦略により,単一取引の損失を効果的に制御できます.

  5. 柔軟な調整. ユーザーは,平均線パラメータと他の技術指標を自分のニーズに応じて調整し,異なる品種と取引スタイルに適した戦略を作ることができます.

リスク分析

この戦略には以下のリスクもあります.

  1. 過剰な信号が発生する可能性がある.双均線策は,集積時に複数の誤差信号が発生する可能性がある.

  2. 単一指標依存. 均線交差のみを用いて意思決定し,他の要因を無視すると,信号品質が劣る可能性がある.

  3. 参数最適化が難しい.平均線周期の参数组を最適化するには大量計算が必要で,最適な参数を見つけるのは容易ではない.

  4. 回測偏差. シンプルな二均線戦略の回測効果は,実盤よりも優れている.

  5. 止損の難しさ. 固定止損ポイントの設定は,状況の変化に適応するのが困難である.

最適化の方向

この戦略は以下の点で最適化できます.

  1. 取引量,波動率などの他の指標のフィルター信号と組み合わせて,整理時に無効信号を生じないようにする.

  2. トレンドベースの判断を増やし,逆転取引を避けます. より長い周期平均線がトレンド方向の判断に加えることができます.

  3. 機械学習を使用して最適参数を探す. 序列参数最適化または遺伝的アルゴリズムを使用して最適参数組み合わせを自動的に探す.

  4. ストップ・トラッキングや移動ストップなどのストップ・ストップ戦略を追加し,ストップ・ストップをより弾力的にする.

  5. 入学時間を最適化します.他の指標を使用して,より効果的な入学時間を特定できます.

  6. 定量化研究と組み合わせたパラメータの組み合わせを回測して最適化し,安定性を高める.

  7. 自動取引システムを開発し,プログラム化された取引を利用してパラメータパッケージの最適化と戦略の評価を行う.

要約する

ライオンの裂け方均衡策略は,初心者のための入門策策である.それは,簡単な双均線交差原理を適用し,ストップ・ストップ・ロスのルールを設定し,ショートラインの価格変動を捕捉することができる.この戦略は,理解しやすく実装され,良好な反測効果がある.しかし,その最適化の難しさは大きい,実体効果は疑わしい.我々は,他の技術指標,最適化パラメータ,自動取引システムの開発などの方法を導入することによって,この戦略を改善することができます.全体的に,ライオンの裂け方均衡策は,量化取引初心者にとって非常に良い学習プラットフォームを提供します.
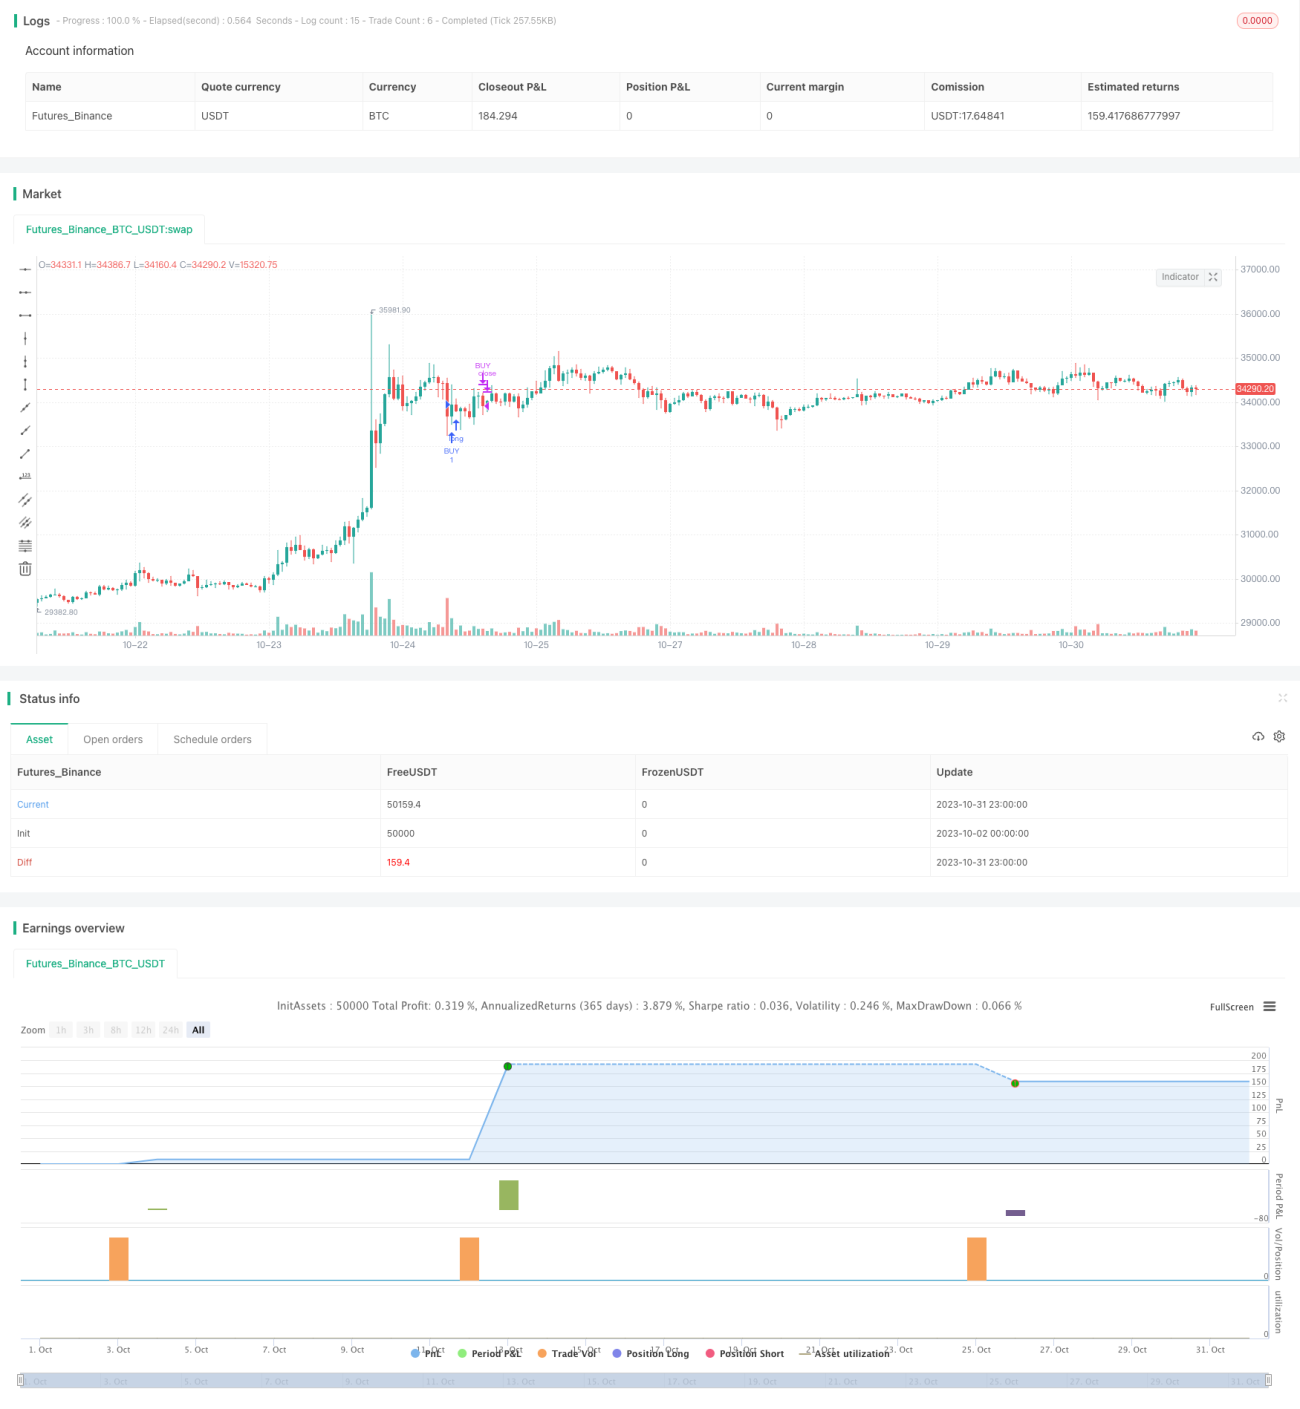
ストラテジーソースコード
/*backtest
start: 2023-10-02 00:00:00
end: 2023-11-01 00:00:00
period: 1h
basePeriod: 15m
exchanges: [{"eid":"Futures_Binance","currency":"BTC_USDT"}]
*/

// This source code is subject to the terms of the Mozilla Public License 2.0 at https://mozilla.org/MPL/2.0/
// © TraderHalai
// This script was born out of my quest to be able to display strategy back test statistics on charts to allow for easier backtesting on devices that do not natively support backtest engine (such as mobile phones, when I am backtesting from away from my computer). There are already a few good ones on TradingView, but most / many are too complicated for my needs.
//
//Found an excellent display backtest engine by 'The Art of Trading'. This script is a snippet of his hard work, with some very minor tweaks and changes. Much respect to the original author.
//
//Full credit to the original author of this script. It can be found here: https://www.tradingview.com/script/t776tkZv-Hammers-Stars-Strategy/?offer_id=10&aff_id=15271
//
// This script can be copied and airlifted onto existing strategy scripts of your own, and integrates out of the box without implementation of additional functions. I've also added Max Runup, Average Win and Average Loss per trade to the orignal script.
//
//Will look to add in more performance metrics in future, as I further develop this script.
//
//Feel free to use this display panel in your scripts and strategies.

//Thanks and enjoy! :)
//@version=5
// strategy("Strategy BackTest Display Statistics - TraderHalai", overlay=true, default_qty_value= 5, default_qty_type = strategy.percent_of_equity, initial_capital=10000,  commission_type=strategy.commission.percent, commission_value=0.1)

//DEMO basic strategy - Use your own strategy here -  Jaws Mean Reversion from my profile used here
source = input(title = "Source", defval = close)
smallMAPeriod = input(title = "Small Moving Average", defval = 2)
bigMAPeriod = input(title = "Big Moving Average", defval = 8)
percentBelowToBuy = input(title = "Percent below to buy %", defval = 1)

smallMA = ta.sma(source, smallMAPeriod)
bigMA =  ta.sma(source, bigMAPeriod) 
buyMA = ((100 - percentBelowToBuy) / 100) * ta.sma(source, bigMAPeriod)[0]

buy = ta.crossunder(smallMA, buyMA)
if(buy)
    strategy.entry("BUY", strategy.long)

if(strategy.openprofit >= strategy.position_avg_price * 0.01) // 1% profit target
    strategy.close("BUY")

if(ta.barssince(buy) >= 7) //Timed Exit, if you fail to make 1 percent in 7 candles.
    strategy.close("BUY")
    
///////////////////////////// --- BEGIN TESTER CODE --- ////////////////////////
// COPY below into your strategy to enable display
////////////////////////////////////////////////////////////////////////////////

// strategy.initial_capital = 50000
// // Declare performance tracking variables
// drawTester = input.bool(true, "Draw Tester")
// var balance = strategy.initial_capital
// var drawdown = 0.0
// var maxDrawdown = 0.0
// var maxBalance = 0.0
// var totalWins = 0
// var totalLoss = 0

// // Prepare stats table
// var table testTable = table.new(position.top_right, 5, 2, border_width=1)
// f_fillCell(_table, _column, _row, _title, _value, _bgcolor, _txtcolor) =>
//     _cellText = _title + "\n" + _value
//     table.cell(_table, _column, _row, _cellText, bgcolor=_bgcolor, text_color=_txtcolor)
    
// // Custom function to truncate (cut) excess decimal places
// truncate(_number, _decimalPlaces) =>
//     _factor = math.pow(10, _decimalPlaces)
//     int(_number * _factor) / _factor
    
// // Draw stats table
// var bgcolor = color.new(color.black,0)
// if drawTester
//     if barstate.islastconfirmedhistory
//         // Update table
//         dollarReturn = strategy.netprofit
//         f_fillCell(testTable, 0, 0, "Total Trades:", str.tostring(strategy.closedtrades), bgcolor, color.white)
//         f_fillCell(testTable, 0, 1, "Win Rate:", str.tostring(truncate((strategy.wintrades/strategy.closedtrades)*100,2)) + "%", bgcolor, color.white)
//         f_fillCell(testTable, 1, 0, "Starting:", "$" + str.tostring(strategy.initial_capital), bgcolor, color.white)
//         f_fillCell(testTable, 1, 1, "Ending:", "$" + str.tostring(truncate(strategy.initial_capital + strategy.netprofit,2)), bgcolor, color.white)
//         f_fillCell(testTable, 2, 0, "Avg Win:", "$"+ str.tostring(truncate(strategy.grossprofit / strategy.wintrades, 2)), bgcolor, color.white)
//         f_fillCell(testTable, 2, 1, "Avg Loss:", "$"+ str.tostring(truncate(strategy.grossloss / strategy.losstrades, 2)), bgcolor, color.white)
//         f_fillCell(testTable, 3, 0, "Profit Factor:", str.tostring(truncate(strategy.grossprofit / strategy.grossloss,2)), strategy.grossprofit > strategy.grossloss ? color.green : color.red, color.white)
//         f_fillCell(testTable, 3, 1, "Max Runup:",  str.tostring(truncate(strategy.max_runup, 2 )), bgcolor, color.white)
//         f_fillCell(testTable, 4, 0, "Return:", (dollarReturn > 0 ? "+" : "") + str.tostring(truncate((dollarReturn / strategy.initial_capital)*100,2)) + "%", dollarReturn > 0 ? color.green : color.red, color.white)
//         f_fillCell(testTable, 4, 1, "Max DD:", str.tostring(truncate((strategy.max_drawdown / strategy.equity) * 100 ,2)) + "%", color.red, color.white)
// // --- END TESTER CODE --- ///////////////