EMAC 指数関数移動平均交差最適化戦略

作者: リン・ハーンチャオチャン,日付: 2023年11月7日 15:16:03
タグ:

img

概要

EMAC指数関数移動平均交差最適化戦略は,基本EMAC戦略に基づいた最適化されたバージョンである.中期から長期間のトレンドを追求することを目的として,トレンド判断,複数の移動平均フィルタリング,ストップ損失/収益出口を組み込む.

戦略の論理

  1. 最近のトレンド方向を判断する:過去26週間の閉じる価格の上昇/減少パーセントを計算し,上昇傾向,下落傾向,横向傾向を決定します.

  2. 複数の移動平均フィルター: 10 期,20 期, 34 期 EMA を計算し,購入信号を誘発するために 50 期 SMA を越えるのを待つ.

  3. ATRストップ損失: 入力信号が表示されたとき,入力バーの低または高マイナス2.5ATRでストップ損失を設定します.

  4. ストップ・ロスの後を追う:価格上昇に伴い,ストップ・ロスの線を徐々に上る.

  5. 収益を上げます 入場シグナルが表示されると 目標値を 3ATR を加えた 閉じる価格で設定します

  6. MA プルバック エクシート:価格が10日間の EMAを下回ったときに積極的に退場する.

利点

  1. 複数のMAフィルターは 信号の信頼性を高め 誤ったブレイクを回避します

  2. ATRストップ・ロスは,市場の変動に基づいて合理的なストップ距離を許可します.

  3. トレイリングストップは上昇するにつれて 利益を得ます

  4. 合理的な利益目標は 過剰な利益を返すのを避けます

  5. MAの引き戻り出口は,トレンドが逆転するときにタイミングで出口を可能にします.

リスク と 解決策

  1. EMAクロスは,横向市場を切り倒し,連続した損失を引き起こす. EMA期間を延長したり,MAクロスオーバーフィルターを追加したりすることができます.

  2. 大幅なATR値は,距離を過ぎてストップを起こすことがあり,損失リスクが高まる.ATR移動平均値または減速係数で最適化することができます.

  3. 夜間ギャップリスクは考慮されていません. 取引期間中のシグナルを避けるために論理を追加できます.

  4. 戦略のスイッチとして市場傾向フィルターを追加できます.

オプティマイゼーションの方向性

  1. EMAの組み合わせをテストして,異なる製品に最適な長さを求めます.

  2. 停止距離を最適化するために,ATR移動平均値や減速係数をテストする.

  3. ロジックを追加して,非取引期間中にシグナルを避ける.

  4. 市場が不利なときに戦略の切り替えとして市場傾向フィルターを追加します.

  5. バックテスト パラメータの組み合わせを 長年に渡って 最適な安定性を見つけるために

概要

EMACの指数関数移動平均クロス最適化戦略は,トレンド判断,複数のMAフィルタリング,ダイナミックストップを組み合わせて中期から長期間のトレンドをフォローする.元のバージョンと比較して,実際の取引パフォーマンスを向上させるためにパラメータ最適化が行われた.しかし,異なる市場状況に対処し,リスクを軽減し,安定性と収益性を向上させるために,より多くの論理を追加することによって,さらなる最適化と強化が必要である.


/*backtest
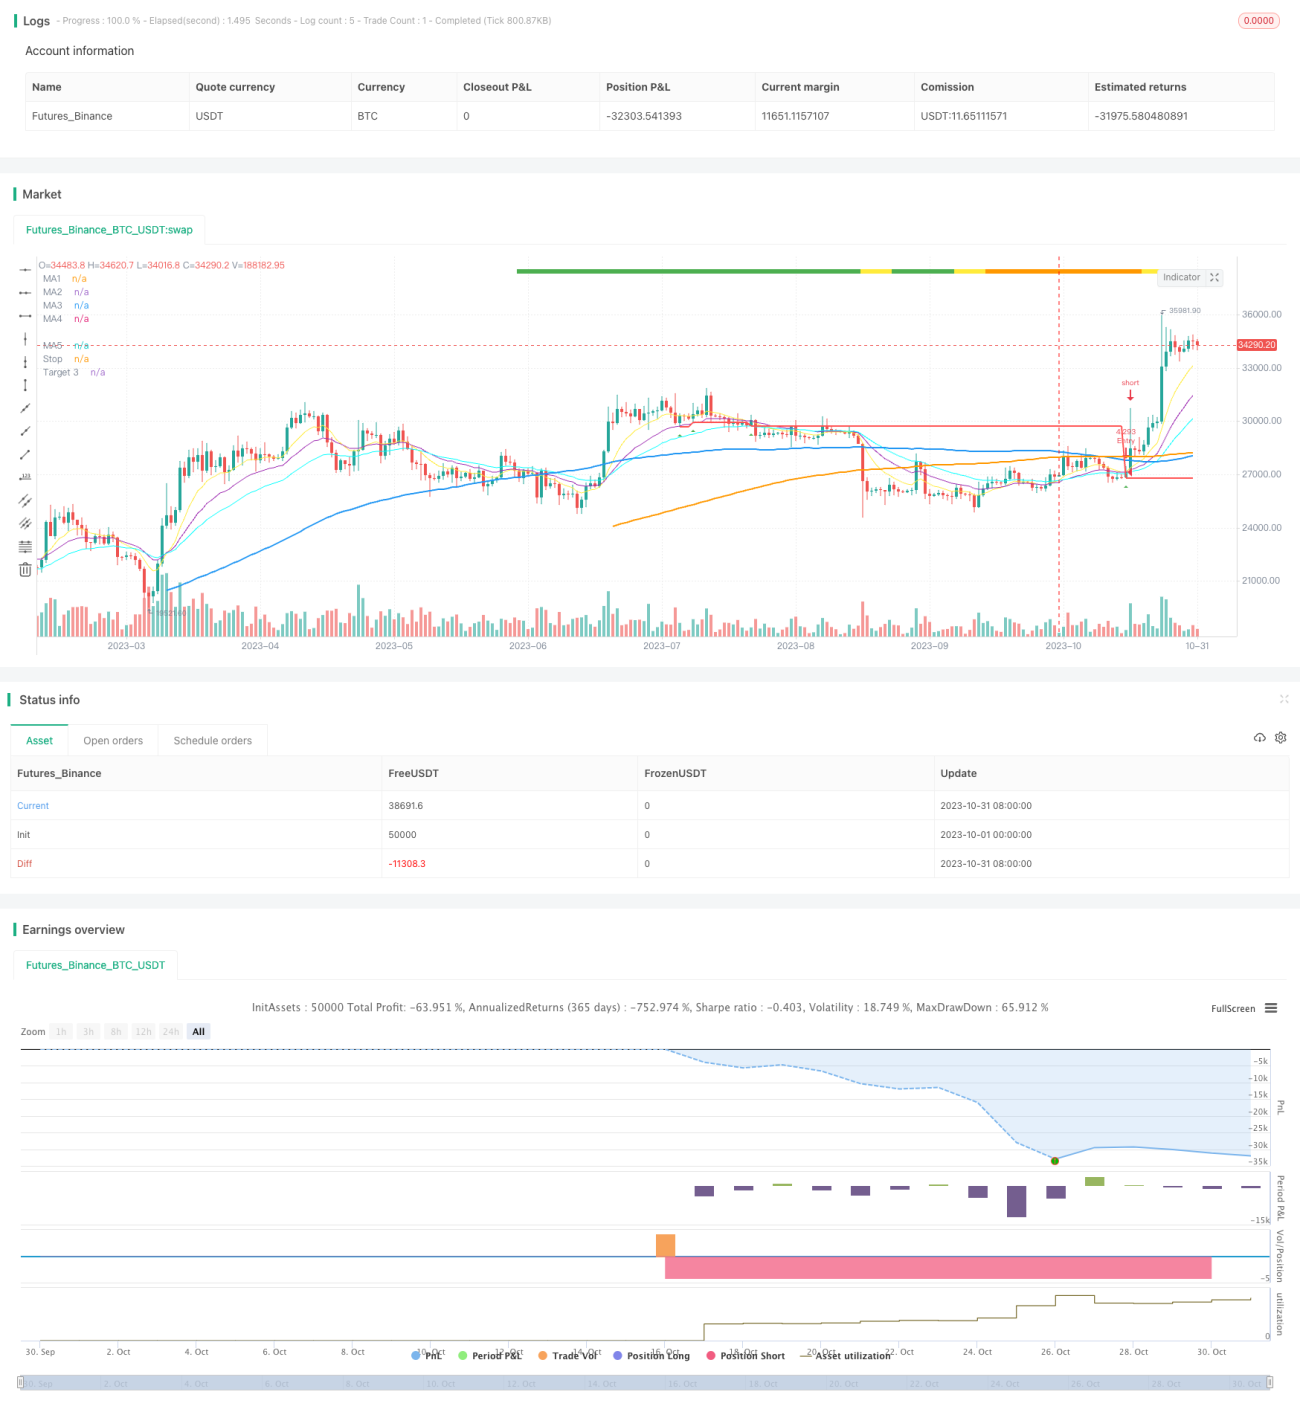
start: 2023-10-01 00:00:00
end: 2023-10-31 23:59:59
period: 1d
basePeriod: 1h
exchanges: [{"eid":"Futures_Binance","currency":"BTC_USDT"}]
*/

//@version=4
//Author = Dustin Drummond https://www.tradingview.com/u/Dustin_D_RLT/
//Strategy based in part on original 10ema Basic Swing Trade Strategy by Matt Delong: https://www.tradingview.com/u/MattDeLong/
//Link to original 10ema Basic Swing Trade Strategy: https://www.tradingview.com/script/8yhGnGCM-10ema-Basic-Swing-Trade-Strategy/
//This is the Original EMAC - Exponential Moving Average Cross Strategy built as a class for reallifetrading dot com and so has all the default settings and has not been optimized
//I would not recomend using this strategy with the default settings and is for educational purposes only
//For the fully optimized version please come back around the same time tomorrow 6/16/21 for the EMAC - Exponential Moving Average Cross - Optimized
//EMAC - Exponential Moving Average Cross
strategy(title="EMAC - Exponential Moving Average Cross", shorttitle = "EMAC", overlay = true, calc_on_every_tick=false, default_qty_value = 100, initial_capital = 100000, default_qty_type = strategy.fixed, pyramiding = 0, process_orders_on_close=true)
//creates a time filter to prevent "too many orders error" and allows user to see Strategy results per year by changing input in settings in Stratey Tester
startYear = input(2015, title="Start Year", minval=1980, step=1)
timeFilter = true
//R Size (Risk Amount)
rStaticOrPercent = input(title="R Static or Percent", defval="Percent", options=["Static", "Percent"])
rSizeStatic = input(2000, title="R Size Static", minval=1, step=100)
rSizePercent = input(3, title="R Size Percent", minval=.01, step=.01)
rSize = rStaticOrPercent == "Static" ? rSizeStatic : rStaticOrPercent == "Percent" ? (rSizePercent * .01 * strategy.equity) : 1
//Recent Trend Indicator "See the standalone version for detailed description"
res = input(title="Trend Timeframe", type=input.resolution, defval="W")
trend = input(26, minval=1, title="# of Bars for Trend")
trendMult = input(15, minval=0, title="Trend Growth %", step=.25) / 100
currentClose = security(syminfo.tickerid, res, close)
pastClose = security(syminfo.tickerid, res, close[trend])
//Trend Indicator
upTrend = (currentClose >= (pastClose * (1 + trendMult)))
downTrend = (currentClose <= (pastClose * (1 - trendMult)))
sidewaysUpTrend = (currentClose < (pastClose * (1 + trendMult)) and (currentClose > pastClose))
sidewaysDownTrend = (currentClose > (pastClose * (1 - trendMult)) and (currentClose < pastClose))
//Plot Trend on Chart
plotshape(upTrend, "Up Trend", style=shape.square, location=location.top, color=color.green, size=size.small)
plotshape(downTrend, "Down Trend", style=shape.square, location=location.top, color=color.red, size=size.small)
plotshape(sidewaysUpTrend, "Sideways Up Trend", style=shape.square, location=location.top, color=color.yellow, size=size.small)
plotshape(sidewaysDownTrend, "Sideways Down Trend", style=shape.square, location=location.top, color=color.orange, size=size.small)
//What trend signals to use in entrySignal
trendRequired = input(title="Trend Required", defval="Red", options=["Green", "Yellow", "Orange", "Red"])
goTrend = trendRequired == "Orange" ? upTrend or sidewaysUpTrend or sidewaysDownTrend : trendRequired == "Yellow" ? upTrend or sidewaysUpTrend : trendRequired == "Green" ? upTrend : trendRequired == "Red" ? upTrend or sidewaysUpTrend or sidewaysDownTrend or downTrend : na
//MAs Inputs Defalt is 10 EMA, 20 EMA, 50 EMA, 100 SMA and 200 SMA
ma1Length = input(10, title="MA1 Period", minval=1, step=1)
ma1Type = input(title="MA1 Type", defval="EMA", options=["SMA", "EMA", "WMA"])
ma2Length = input(20, title="MA2 Period", minval=1, step=1)
ma2Type = input(title="MA2 Type", defval="EMA", options=["SMA", "EMA", "WMA"])
ma3Length = input(34, title="MA3 Period", minval=1, step=1)
ma3Type = input(title="MA3 Type", defval="EMA", options=["SMA", "EMA", "WMA"])
ma4Length = input(100, title="MA4 Period", minval=1, step=1)
ma4Type = input(title="MA4 Type", defval="SMA", options=["SMA", "EMA", "WMA"])
ma5Length = input(200, title="MA5 Period", minval=1, step=1)
ma5Type = input(title="MA5 Type", defval="SMA", options=["SMA", "EMA", "WMA"])
//MAs defined
ma1 = ma1Type == "EMA" ? ema(close, ma1Length) : ma1Type == "SMA" ? sma(close, ma1Length) : wma(close, ma1Length)
ma2 = ma2Type == "EMA" ? ema(close, ma2Length) : ma2Type == "SMA" ? sma(close, ma2Length) : wma(close, ma2Length)
ma3 = ma3Type == "EMA" ? ema(close, ma3Length) : ma3Type == "SMA" ? sma(close, ma3Length) : wma(close, ma3Length)
ma4 = ma4Type == "SMA" ? sma(close, ma4Length) : ma4Type == "EMA" ? ema(close, ma4Length) : wma(close, ma4Length)
ma5 = ma5Type == "SMA" ? sma(close, ma5Length) : ma5Type == "EMA" ? ema(close, ma5Length) : wma(close, ma5Length)
//Plot MAs
plot(ma1, title="MA1", color=color.yellow, linewidth=1, style=plot.style_line)
plot(ma2, title="MA2", color=color.purple, linewidth=1, style=plot.style_line)
plot(ma3, title="MA3", color=#00FFFF, linewidth=1, style=plot.style_line)
plot(ma4, title="MA4", color=color.blue, linewidth=2, style=plot.style_line)
plot(ma5, title="MA5", color=color.orange, linewidth=2, style=plot.style_line)
//Allows user to toggle on/off ma1 > ma2 filter
enableShortMAs = input(title="Enable Short MA Cross Filter", defval="No", options=["Yes", "No"])
shortMACross = enableShortMAs == "Yes" and ma1 > ma2 or enableShortMAs == "No"
//Allows user to toggle on/off ma4 > ma5 filter
enableLongMAs = input(title="Enable Long MA Cross Filter", defval="No", options=["Yes", "No"])
longMACross = enableLongMAs == "Yes" and ma4 >= ma5 or enableLongMAs == "No"
//Entry Signals
entrySignal = (strategy.position_size <= 0 and close[1] < ma1[1] and close > ma1 and close > ma2 and close > ma3 and shortMACross and ma1 > ma3 and longMACross and goTrend)
secondSignal = (strategy.position_size > 0 and close[1] < ma1[1] and close > ma1 and close > ma2 and close > ma3 and shortMACross and ma1 > ma3 and longMACross and goTrend)
plotshape(entrySignal, style=shape.triangleup, location=location.belowbar, color=color.green, size=size.small)
plotshape(secondSignal, style=shape.triangleup, location=location.belowbar, color=color.lime, size=size.small)
//ATR for Stops
atrValue = (atr(14))
//to test ATR enable next line
//plot(atrValue, linewidth=1, color=color.black, style=plot.style_line)
atrMult = input(2.5, minval=.25, step=.25, title="Stop ATR Multiple")
//Only target3Mult is used in current strategy target1 and target2 might be used in the future with pyramiding
//target1Mult = input(1.0, minval=.25, step=.25, title="Targert 1 Multiple")
//target2Mult = input(2.0, minval=.25, step=.25, title="Targert 2 Multiple")
target3Mult = input(3.0, minval=.25, step=.25, title="Target Multiple")
enableAtrStop = input(title="Enable ATR Stops", defval="No", options=["Yes", "No"])
//Intitial Recomended Stop Location
atrStop = entrySignal and ((high - (atrMult * atrValue)) < low) ? (high - (atrMult * atrValue)) : low
//oneAtrStop is used for testing only enable next 2 lines to test
//oneAtrStop = entrySignal ? (high - atrValue) : na
//plot(oneAtrStop, "One ATR Stop", linewidth=2, color=color.orange, style=plot.style_linebr)
initialStop = entrySignal and enableAtrStop == "Yes" ? atrStop : entrySignal ? low : na
//Stops changed to stoploss to hold value for orders the next line is old code "bug"
//plot(initialStop, "Initial Stop", linewidth=2, color=color.red, style=plot.style_linebr)
//Set Initial Stop and hold value "debug code"
stoploss = valuewhen(entrySignal, initialStop, 0)
plot(stoploss, title="Stop", linewidth=2, color=color.red)
enableStops = input(title="Enable Stops", defval="No", options=["Yes", "No"])
yesStops = enableStops == "Yes" ? 1 : enableStops == "No" ? 0 : na
//Calculate size of trade based on R Size
//Original buggy code: 
//positionSize = (rSize/(close - initialStop))
//Added a minimum order size of 1 "debug code"
positionSize = (rSize/(close - initialStop)) > 1 ? (rSize/(close - initialStop)) : 1
//Targets
//Enable or Disable Targets
enableTargets = input(title="Enable Targets", defval="No", options=["Yes", "No"])
yesTargets = enableTargets == "Yes" ? 1 : enableTargets == "No" ? 0 : na
//Only target3 is used in current strategy target1 and target2 might be used in the future with pyramiding
//target1 = entrySignal ? (close + ((close - initialStop) * target1Mult)) : na
//target2 = entrySignal ? (close + ((close - initialStop) * target2Mult)) : na
target3 = entrySignal ? (close + ((close - initialStop) * target3Mult)) : na
//plot(target1, "Target 1", linewidth=2, color=color.green, style=plot.style_linebr)
//plot(target2, "Target 2", linewidth=2, color=color.green, style=plot.style_linebr)
plot(target3, "Target 3", linewidth=2, color=color.green, style=plot.style_linebr)
//Set Target and hold value "debug code"
t3 = valuewhen(entrySignal, target3, 0)
//To test t3 and see plot enable next line
//plot(t3, title="Target", linewidth=2, color=color.green)
//MA1 Cross Exit
enableEarlyExit = input(title="Enable Early Exit", defval="Yes", options=["Yes", "No"])
earlyExit = enableEarlyExit == "Yes" ? 1 : enableEarlyExit == "No" ? 0 : na
ma1CrossExit = strategy.position_size > 0 and close < ma1
//Entry Order
strategy.order("Entry", long = true, qty = positionSize, when = (strategy.position_size <= 0 and entrySignal and timeFilter))
//Early Exit Order
strategy.close_all(when = ma1CrossExit and timeFilter and earlyExit, comment = "MA1 Cross Exit")
//Stop and Target Orders
//strategy.cancel orders are needed to prevent bug with Early Exit Order
strategy.order("Stop Loss", false, qty = strategy.position_size, stop=stoploss, oca_name="Exit",  when = timeFilter and yesStops, comment = "Stop Loss")
strategy.cancel("Stop Loss", when = ma1CrossExit and timeFilter and earlyExit)
strategy.order("Target", false, qty = strategy.position_size, limit=t3, oca_name="Exit",  when = timeFilter and yesTargets, comment = "Target")
strategy.cancel("Target", when = ma1CrossExit and timeFilter and earlyExit)

もっと