
多時間枠RSI均線交差策略は,多時間枠のトレンド追跡策略である.この策略は,複数の時間枠のRSI指標を同時に使用し,各時間枠のRSIを重み付けの移動平均処理して,最終的に2つの総合信号指標として統合され,二つの信号指標が金叉の発生時に多し,死叉の発生時に空し,典型的な双均線交差策に属している.
この戦略は,RSIを複数の時間枠 (例えば,1分,5分,15分など) で計算し,それぞれの時間枠のRSIを15の長さの加重移動平均 (VMA) で処理し,各時間枠のRSIの平均値を得ます.
その後,すべての時間枠のRSI平均線を等重結合して,それぞれ速線と遅線の2つの信号に結合します. 速線の長さは100周期のEMA,慢線の長さは150周期のEMAです.
速線が下から上へと緩慢線を突破すると買い信号が生じ,速線が上から下へと緩慢線を突破すると売り信号が生じます.このように,多時間枠RSIの総合的な交差信号は,短期市場のノイズをフィルターしながら,トレンドを効果的に追跡できます.
複数の時間枠を統合して,価格曲線を平坦にし,偽の突破を効果的にフィルターします.
RSI指標は,超買い超売り状態を反映し,上下を追うのを避ける.
双均線は単一均線システムよりポジション保持の効果が優れている.
VMAをSMAではなく使用することで,短期的な波動が平均線に与える影響を減らすことができます.
多時間枠戦略,パラメータ調整要求が高い,不適切な設定は,早すぎたり遅すぎたりする可能性がある.
均線システムは曲線適合に不十分で,トレンドの転換点でのパフォーマンスは劣っている.
RSIは反転信号に注意してください.
解決方法:タイムフレームのパラメータ設定を調整し,MACDなどの他の指標と組み合わせてトレンドを判断し,RSIがシグナルから外れていることを警告します.
タイムフレームの数値とパラメータの設定を最適化して,トレンドをより良く捉える.
リスク管理のための 損失防止メカニズムの導入を検討する.
他の指標と組み合わせて,傾向と偏差を判断し,意思決定の質を向上させる.
異なるポジション周期パラメータをテストし,最適のポジション保持効果を探します.
多時間枠RSI均線交差戦略は,複数の時間枠RSI指標の総合的な判断により,均線システムを利用して価格曲線を平らにし,取引シグナルを生成し,典型的な多時間枠トレンド追跡戦略に属している.この戦略の優点は,トレンドを効果的に追跡し,同時にノイズをフィルターすることにあるが,パラメータの最適化とリスク管理に注意する必要がある.さらに最適化することで,この戦略はより強力なトレンド追跡システムになることができる.
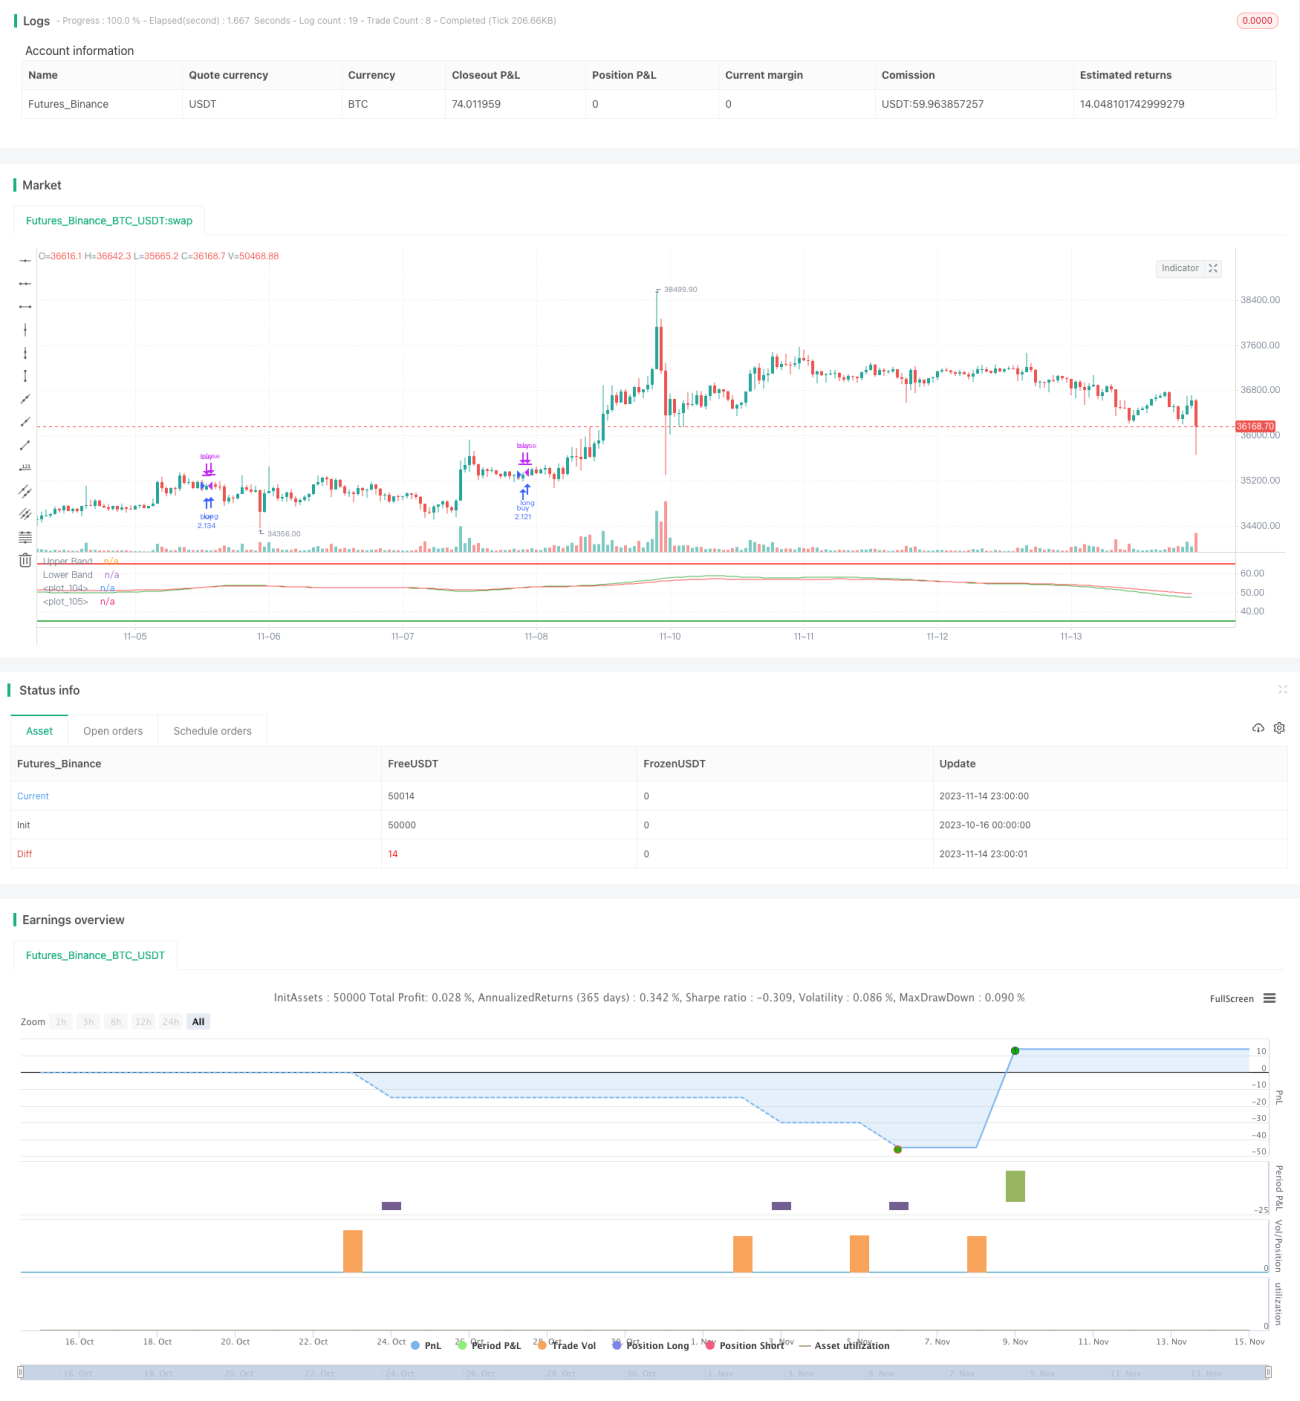
/*backtest
start: 2023-10-16 00:00:00
end: 2023-11-15 00:00:00
period: 1h
basePeriod: 15m
exchanges: [{"eid":"Futures_Binance","currency":"BTC_USDT"}]
*/
//@version=4
strategy(title="RSI multitimeframe SMA crossover", shorttitle="RSI multitimeframe strategy", default_qty_type= strategy.percent_of_equity, margin_long=50, default_qty_value=150)
res1 = input(title="Res 01", type=input.resolution, defval="1")
res2 = input(title="Res 0", type=input.resolution, defval="5")
res3 = input(title="Res 1", type=input.resolution, defval="15")
res4 = input(title="Res 2", type=input.resolution, defval="15")
res5 = input(title="Res 3", type=input.resolution, defval="15")
res6 = input(title="Res 4", type=input.resolution, defval="30")
res7 = input(title="Res 5", type=input.resolution, defval="45")
res8 = input(title="Res 6", type=input.resolution, defval="60")
lengthRSI = input(15, minval=1)
lengthMA = input(15, minval=1)
lengthFMA = input(100, minval=1)
lengthFMA2 = input(150, minval=1)
Long_yes = input(defval=1, title="Long trades 0 or 1", minval=0, maxval=1)
Short_yes = input(defval=0, title="Short trades 0 or 1", minval=0, maxval=1)
src = close
// === INPUT BACKTEST RANGE ===
fromMonth = input(defval = 1, title = "From Month", type = input.integer, minval = 1, maxval = 12)
fromDay = input(defval = 1, title = "From Day", type = input.integer, minval = 1, maxval = 31)
fromYear = input(defval = 2020, title = "From Year", type = input.integer, minval = 1970)
thruMonth = input(defval = 1, title = "Thru Month", type = input.integer, minval = 1, maxval = 12)
thruDay = input(defval = 1, title = "Thru Day", type = input.integer, minval = 1, maxval = 31)
thruYear = input(defval = 2112, title = "Thru Year", type = input.integer, minval = 1970)
// === INPUT SHOW PLOT ===
showDate = input(defval = true, title = "Show Date Range", type = input.bool)
// === FUNCTION EXAMPLE ===
start = timestamp(fromYear, fromMonth, fromDay, 00, 00) // backtest start window
finish = timestamp(thruYear, thruMonth, thruDay, 23, 59) // backtest finish window
window() => time >= start and time <= finish ? true : false // create function "within window of time"
// stop loss
longLossPerc = input(title="Long Stop Loss (%)", type=input.float, minval=0.0, step=0.5, defval=10) *
0.01
longStopPrice = strategy.position_avg_price * (1 - longLossPerc)
shortLossPerc = input(title="Short Stop Loss (%)", type=input.float, minval=0.0, step=0.5, defval=10) *
0.01
shortStopPrice = strategy.position_avg_price * (1 + shortLossPerc)
rsi1 = rsi(src, lengthRSI)
MA1 = vwma(rsi1, lengthMA)
outD1 = security(syminfo.tickerid, res1, MA1)
outD2 = security(syminfo.tickerid, res2, MA1)
outD3 = security(syminfo.tickerid, res3, MA1)
outD4 = security(syminfo.tickerid, res4, MA1)
outD5 = security(syminfo.tickerid, res5, MA1)
outD6 = security(syminfo.tickerid, res6, MA1)
outD7 = security(syminfo.tickerid, res7, MA1)
outD8 = security(syminfo.tickerid, res8, MA1)
//plot_d0 = outD0
//plot_d1 = outD1
//plot_d2 = outD2
//plot_d3 = outD3
//plot_d4 = outD4
//plot_d5 = outD5
//plot_d6 = outD6
out_multi = ema(outD1+outD2+outD3+outD4+outD5+outD6+outD7+outD8, lengthFMA)
out_multi2 = ema(outD1+outD2+outD3+outD4+outD5+outD6+outD7+outD8, lengthFMA2)
//out_multi1 = outD2+outD3+outD4
//out_multi2 = outD4+outD5+outD6
//col0 = outD0 < 20 ? color.lime : outD0 > 80 ? color.red : color.blue
//col1 = outD1 < 20 ? color.lime : outD1 > 80 ? color.red : color.blue
//col2 = outD2 < 20 ? color.lime : outD2 > 80 ? color.red : color.blue
//col3 = outD3 < 20 ? color.lime : outD3 > 80 ? color.red : color.blue
//col4 = outD4 < 20 ? color.lime : outD4 > 80 ? color.red : color.blue
//col5 = outD5 < 20 ? color.lime : outD5 > 80 ? color.red : color.blue
//col6 = outD6 < 20 ? color.lime : outD6 > 80 ? color.red : color.blue
// plot(plot_d0,linewidth=2, color=col0)
// plot(plot_d1, linewidth=2, color=col1)
// plot(plot_d2,linewidth=2, color=col2)
// plot(plot_d3,linewidth=2, color=col3)
// plot(plot_d4,linewidth=2, color=col4)
// plot(plot_d5,linewidth=2, color=col5)
// plot(plot_d6,linewidth=2, color=col6)
long=(out_multi/8)
short=(out_multi2/8)
plot(long, linewidth=1, color=color.green)
plot(short, linewidth=1, color=color.red)
long1=crossover(long,short)
short1=crossunder(long,short)
h0 = hline(65, "Upper Band", color=color.red, linestyle=hline.style_solid, linewidth=2 )
h1 = hline(35, "Lower Band", color=color.green, linestyle=hline.style_solid, linewidth=2)
strategy.entry("buy", strategy.long, when=long1 and window() and Long_yes > 0)
if strategy.position_size > 0
strategy.exit(id="XL STP", stop=longStopPrice)
strategy.close("buy",when=short1 )
strategy.entry("sell", strategy.short, when=short1 and window() and Short_yes > 0)
if strategy.position_size < 0
strategy.exit(id="XS STP", stop=shortStopPrice)
strategy.close("buy",when=long1 )