波動チャネルとマネーフロー指標に基づくトレンドフォロー戦略

概要
この戦略は,波のチャネル指標と資金流動指標を組み合わせて,トレンドの方向を識別し,トレンドを追跡する.この戦略は,15分間の時間周期で動作し,波のチャネルを通じて価格の方向を判断し,その後,資金流動指標を使用してトレンドを確認し,超短線のトレンドを追跡する.
戦略原則
波の通道指標 ((WaveTrend) は,価格のトレンド方向を効果的に識別することができる.それは,通道平均線,通道平均価格,通道インデックスで構成されている.通道平均線は,価格の指数移動平均線であり,価格トレンドを反映する.通道平均線は,通道平均線の移動平均で,通道平均線を定位するために使用される.通道インデックスは,通道平均線から価格の偏差を反映し,超買超売信号を与える.
資金流動指数 (CMF) は,資金の流入と流出を判断し,トレンドを確認する.この指標は,取引量調整後の蓄積/派生ラインに基づいて,買い手と売り手の力の対比を反映する.値が0近くで資金流入と流出のバランスを表示する.0未満は資金流出を表示し,0以上は資金流入を表示する.
この策略は15分周期で動作し,波動通路指標によって価格トレンドの方向を判断した後,資金流動指標を使用して確認し,その傾向を追跡する.具体的には,波動通路指標のチャネルインデックスが-60より低く,資金流動指標が-0.2より小さい場合,多額の取引を行う.波動通路指標のチャネルインデックスが60より高く,資金流動指標が-0.2より大きい場合,空白の取引を行う.条件付きの資金流動指標が主として,多額の取引の資金流動指標が0.18時より大きい場合,空白の資金流動指標が-0.18時より小さい場合,空白の取引を行う.
戦略的優位性
- 波の通路の指標は価格の方向を効果的に判断します.
- 資金流動指標はトレンドの方向を確認し,誤った取引を回避します.
- 超短線のトレンドトラッキングは,波の通路と資金流動指標を組み合わせて実現できます.
- 15分周期で動作し,短線操作に適した
戦略リスク
- 波の通路指標は,整合中に誤信号を生成する可能性があります
- 資金流動指標は,トレンド転換点に遅れをとる可能性がある
- 単一サイクルでの操作はリスクが高いため,適切な緩解期間の保持
- 損失を抑える戦略がなく,単一損失をコントロールできない
リスク対策:
- 他の指標と組み合わせて確認し,誤信号を避ける
- 資金流動指標のパラメータを適切に調整し,感受性を高めること
- 適当な長期化により,単一期間のリスクを低減する
- 移動ストップ,転置ストップなどの戦略を増加させ,損失を制御する.
戦略最適化の方向性
- ポジションの最適化により,戦略がトレンドを追跡できる
- 単一損失を抑えるためのストップ・ロース戦略を強化する
- ストッチ多空指標などと組み合わせて,単一の指標による誤信号を避ける
- ポジションの長さを測り,最適なポジション周期を探します.
- 資金流動指標のパラメータを最適化して,最適なパラメータの組み合わせを見つける
要約する
この戦略は,波通路指標を用いてトレンドの方向を判断し,資金流動指標で確認し,超ショートラインのトレンド追跡操作を実現する.戦略の優点は,指標の組み合わせが合理的で,効率的にトレンドを追跡でき,15分周期の運用がショートライン操作に適していることにある.しかし,指標シグナル不正確さ,ポジション保持時間が短すぎるなどのリスクもある.将来,ストップ・ロース戦略,パラメータ最適化,信号フィルタリングの追加などの方法でさらに最適化することができ,戦略の安定性と収益率が向上する.
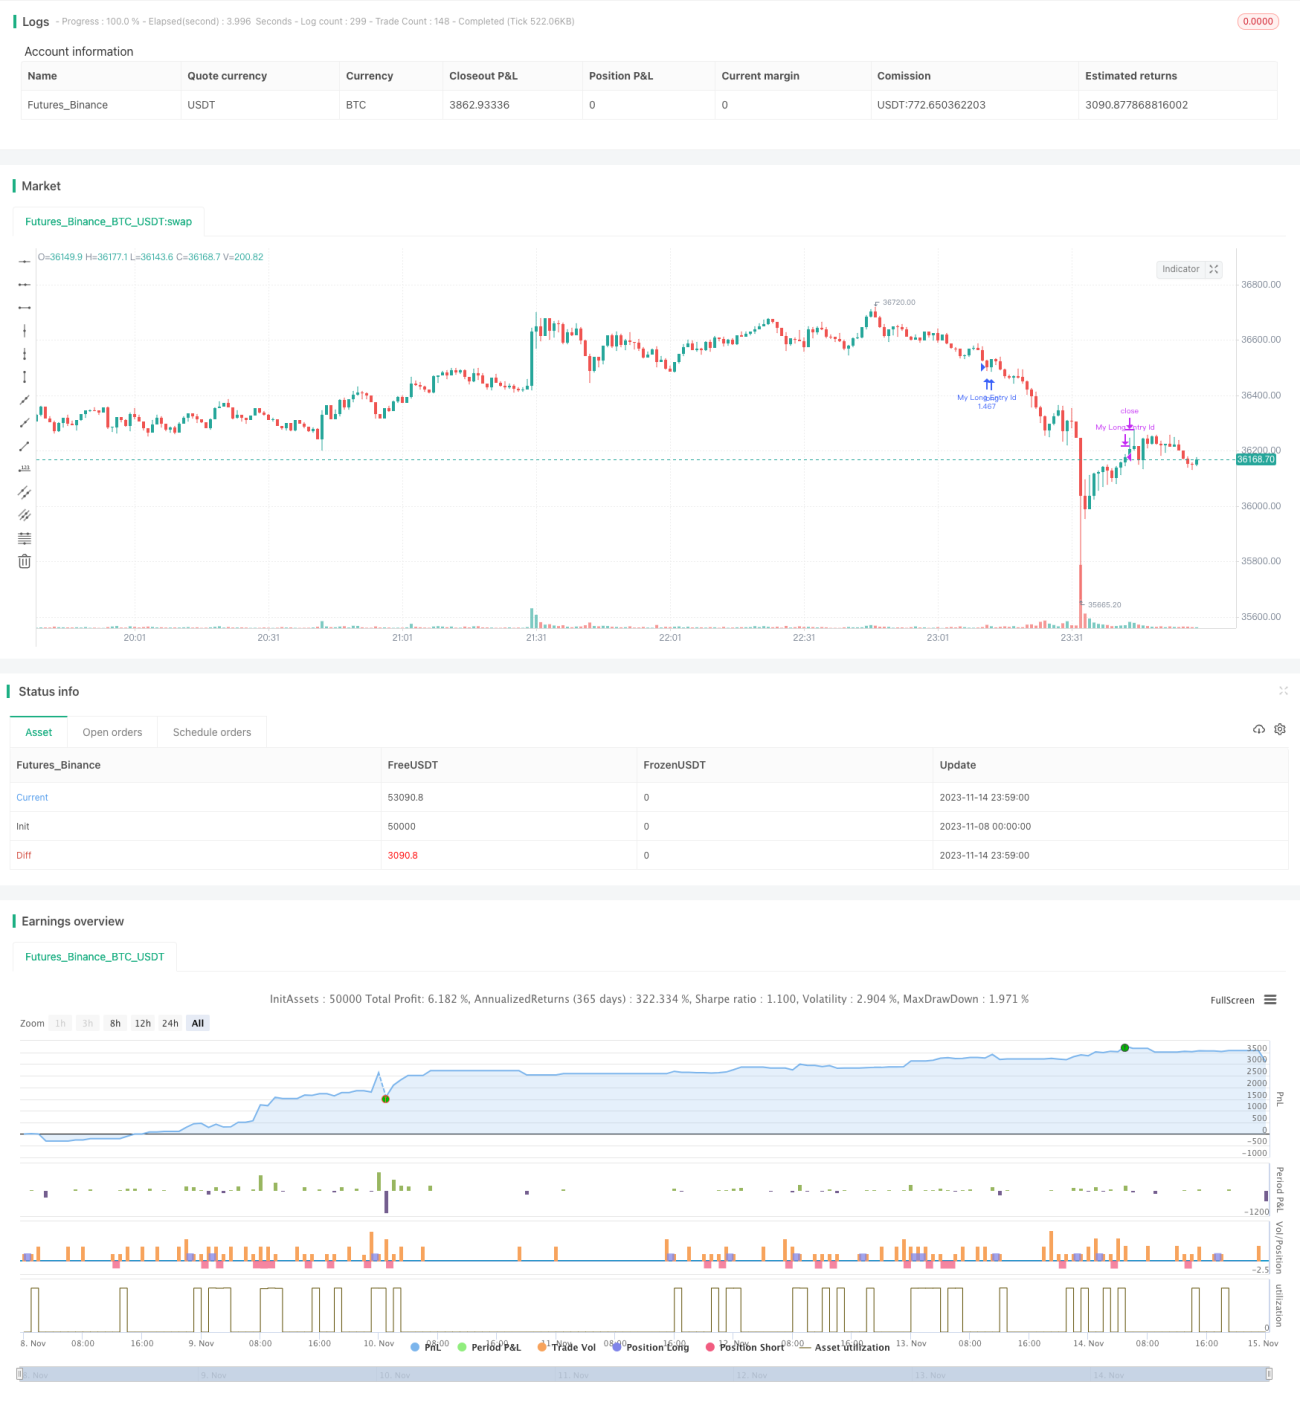
/*backtest
start: 2023-11-08 00:00:00
end: 2023-11-15 00:00:00
period: 1m
basePeriod: 1m
exchanges: [{"eid":"Futures_Binance","currency":"BTC_USDT"}]
*/

//@version=3
strategy(title = "CMF - WaveTrend", shorttitle = "CMF - WaveTrend", overlay = true, pyramiding = 0, default_qty_type = strategy.percent_of_equity, default_qty_value = 100, currency = currency.EUR)

//Chaikin Money Flow- 1