ダブル移動平均クロスオーバーモメンタム戦略


作成日: 2023-11-16 17:25:13 最終変更日: 2023-11-16 17:25:13
コピー: 0 クリック数: 651
1
フォロー
1617
フォロワー

ダブル移動平均クロスオーバーモメンタム戦略

概要

この策略は,双均線交差原理を適用し,MACD指標のトレンド判断と背景突出交差点を組み合わせ,形状点の入場を補助し,市場の中期トレンドを捕捉することを目的としています. 主な論理は,均線方向の転換が起こる時に入場し,MACD背景色を通過して突出交差点を,MACD直角図の色変化判断と連携して入場します.

戦略原則

戦略は,高速EMAと遅いEMAを使用して,両均線と高速線を交差してトレンドの方向を判断する.同時に,MACDとSignalを計算し,その差値を直角図として描画する.

コードによると,快線長さは12で,慢線長さは26で,短期と長期のトレンドを表している. 信号長さは9で,追加の滑り処理が行われている.

横断的な論理:

  • trend_up = macd > signal: 短期的な上昇傾向を表す,速い線で遅い線を横切る
  • trend_dn = macd < signal: 速線の下の緩い線を穿越し,短期的な下降トレンドを表す

交差点の判断:

  • cross_UP = signal[1] >= macd[1] and signal < macd: 速線は下から遅線を貫く
  • cross_DN = signal[1] <= macd[1] and signal > macd:速線は上から下を通過する

縦図の色の変化は,トレンドの強さを判断します.

  • histA_IsUp = 縦図柱が0より大きく成長し,上昇強度の増強を表す
  • histA_IsDown = 直角図の柱が0より小さく大きくなり,上昇力の弱まりを表す
  • 下の同理

戦略的優位性

  1. 短期市場の騒音から遠ざかるために,二重均等線を用いて中期トレンドの方向を判断する

  2. MACDは短期的な傾向と強さを判断し,利益の確率を高める

  3. 直角図の色の変化は,強度の大きさを判定し,入場タイミングを把握する.

  4. 交差点の背景の色は目に見える

  5. 異なる市場環境に対応するカスタマイズ可能な均線周期

  6. MACDパラメータを調整して指標効果を最適化

  7. 複数の入場確認を提供:均線方向,指標交差,形状突破

戦略リスク

  1. 双均線判断 中期トレンドは短期変動に無感で,ショートラインのチャンスを逃す可能性がある

  2. MACDのパラメータが正しく設定されず,指標はうまく機能せず,誤った信号を発信する

  3. 平均線とMACD信号の入力だけで,ある程度の盲目性が存在します.

  4. 損失拡大の危険性がある.

  5. 資金管理とポジション管理の厳しさの欠如

解決策はこうです

  1. 短期変動の範囲を制限し,他の指標と組み合わせてリスクを制御します.

  2. MACDパラメータを最適化し,異なる市場での効果をテストする

  3. 形状,モメンタムなどの要素を追加して確認信号

  4. 単一の損失を避けるために,損失防止の仕組みを確立する

  5. 資金管理モジュールに追加し,資金規模に応じて単位のポジションを制御

戦略最適化の方向性

  1. テストの最適化均線パラメータの組み合わせ,より多くの市場状況に適応

  2. VWAP,ブリン帯中線など

  3. 偽の突破を避けるために,交通量の増加を考慮する.

  4. RSIなどの指標と組み合わせて,超買いと超売りを確認

  5. 移動式・振動式・振動式・振動式・振動式・振動式・振動式・振動式・振動式・振動式

  6. ポジション管理機構への加入,資金の大きさによる単一ポジションの管理

  7. 機械学習アルゴリズムと組み合わせたパラメータの最適化を考慮する

  8. Universeを拡大し,ポートフォリオを深める

要約する

この戦略は,二重均線トレンド判断とMACD動態指標を統合し,形状特性を加え,比較的安定した中期取引戦略を構築している.核心的な優位性は,主要トレンドの方向を把握し,短期市場の騒音に邪魔されないことである.しかし,ストップ・パーズ・メカニズム,リスク管理などの面で最適化可能なスペースもある.全体的に,この戦略は,概念の証明として良好な参照価値を有しているが,実際の落下は,全面的なテストと最適化調整を経なければならない.
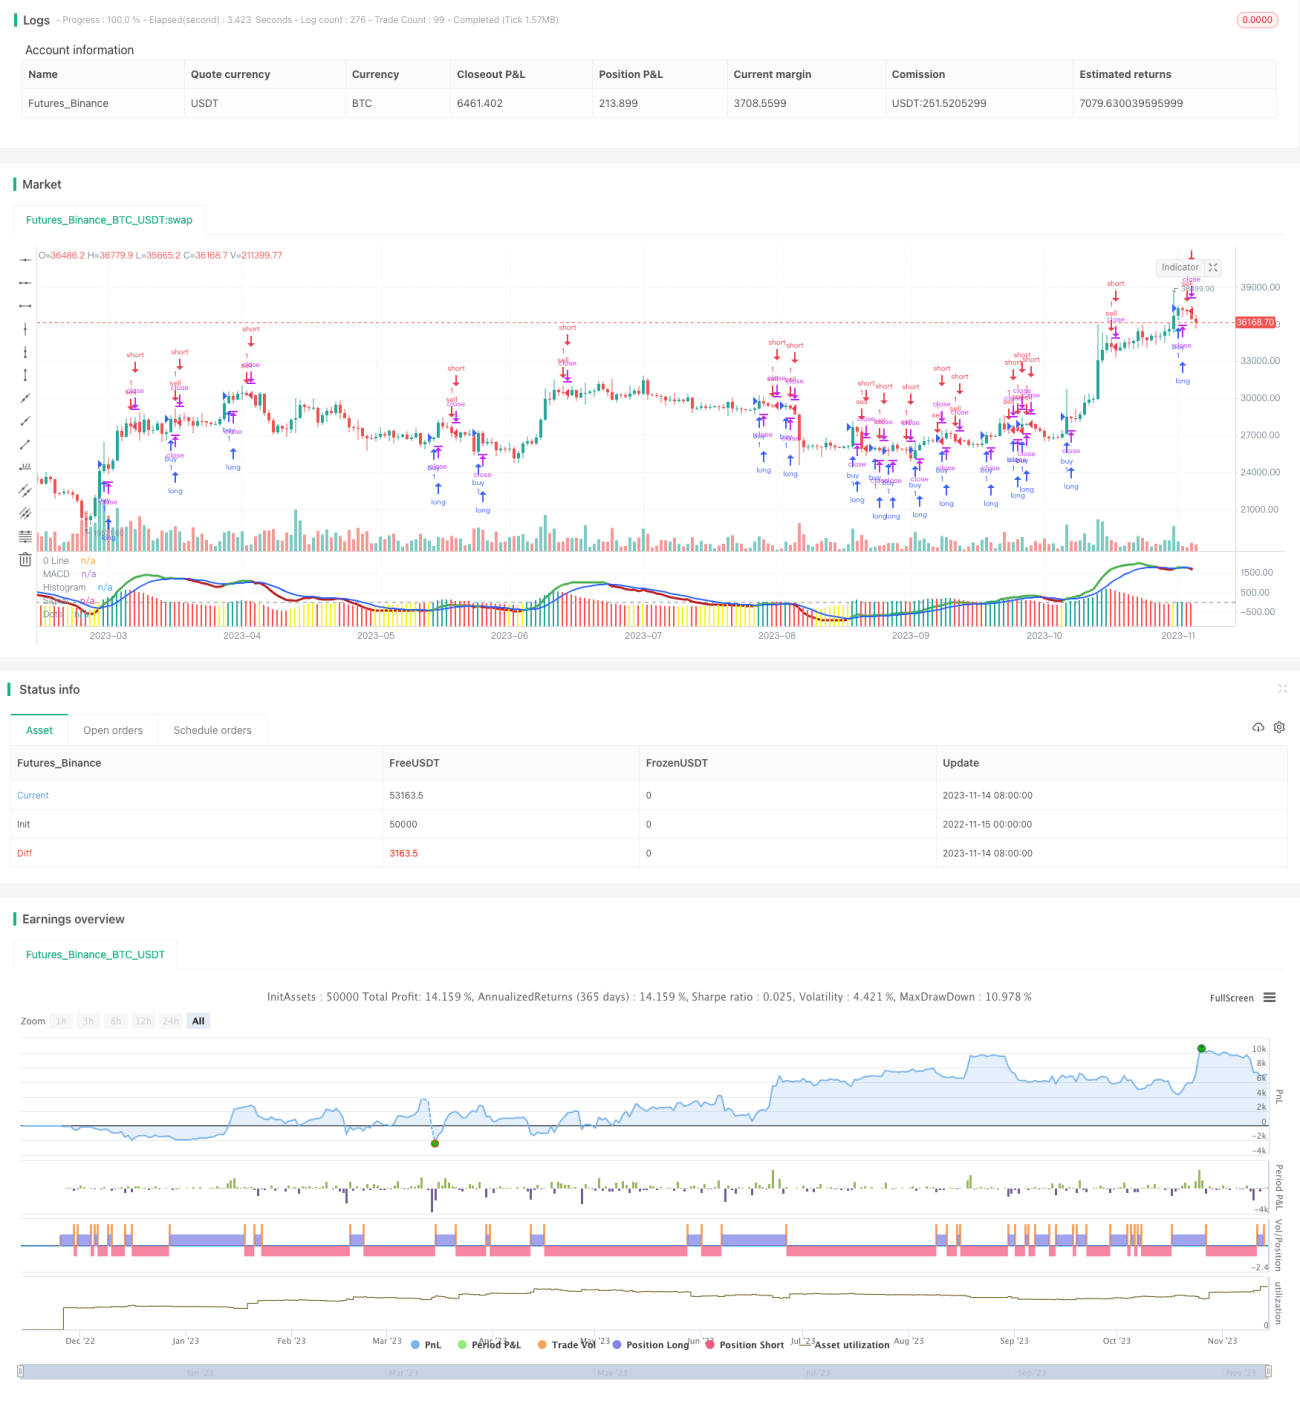
ストラテジーソースコード
/*backtest
start: 2022-11-15 00:00:00
end: 2023-11-15 00:00:00
period: 1d
basePeriod: 1h
exchanges: [{"eid":"Futures_Binance","currency":"BTC_USDT"}]
*/

//@version=5
strategy(title="Histogram MacD MVP_V2.1", shorttitle="Histogram MacD MVP_2.1")
//Plot Inputs
res           = input.timeframe("",  "Indicator TimeFrame")
fast_length   = input.int(title="Fast Length", defval=12)
slow_length   = input.int(title="Slow Length", defval=26)
src           = input.source(title="Source", defval=close)
signal_length = input.int(title="Signal Smoothing", minval = 1, maxval = 999, defval = 9)
sma_source    = input.string(title="Oscillator MA Type", defval="EMA", options=["SMA", "EMA"])
sma_signal    = input.string(title="Signal Line MA Type", defval="EMA", options=["SMA", "EMA"])
// Show Plots T/F
show_macd     = input.bool(true, title="Show MACD Lines", group="Show Plots?", inline="SP10")
show_macd_LW  = input.int(3, minval=0, maxval=5, title = "MACD Width", group="Show Plots?", inline="SP11")
show_signal_LW= input.int(2, minval=0, maxval=5, title = "Signal Width", group="Show Plots?", inline="SP11")
show_Hist     = input.bool(true, title="Show Histogram", group="Show Plots?", inline="SP20")
show_hist_LW  = input.int(5, minval=0, maxval=5, title = "-- Width", group="Show Plots?", inline="SP20")
show_trend    = input.bool(true, title = "Show MACD Lines w/ Trend Color", group="Show Plots?", inline="SP30")
show_HB       = input.bool(false, title="Show Highlight Price Bars", group="Show Plots?", inline="SP40")
show_cross    = input.bool(false, title = "Show BackGround on Cross", group="Show Plots?", inline="SP50")
show_dots     = input.bool(true, title = "Show Circle on Cross", group="Show Plots?", inline="SP60")
show_dots_LW  = input.int(5, minval=0, maxval=5, title = "-- Width", group="Show Plots?", inline="SP60")

//show_trend    = input(true, title = "Colors MACD Lines w/ Trend Color", group="Show Plots?", inline="SP5")
// MACD Lines colors
col_macd      = input.color(#FF6D00, "MACD Line  ",  group="Color Settings", inline="CS1")
col_signal    = input.color(#2962FF, "Signal Line  ",  group="Color Settings", inline="CS1")
col_trnd_Up   = input.color(#4BAF4F, "Trend Up      ",  group="Color Settings", inline="CS2")
col_trnd_Dn   = input.color(#B71D1C, "Trend Down    ",  group="Color Settings", inline="CS2")
// Histogram Colors
col_grow_above = input.color(#26A69A, "Above   Grow",  group="Histogram Colors", inline="Hist10")
col_fall_above = input.color(#FF5252, "Fall",  group="Histogram Colors", inline="Hist10")
col_grow_below = input.color(#FF5252, "Below Grow",  group="Histogram Colors", inline="Hist20")
col_fall_below = input.color(#f8f524, "Fall",  group="Histogram Colors", inline="Hist20")
// Alerts T/F Inputs
alert_Long    = input.bool(true, title = "MACD Cross Up", group = "Alerts", inline="Alert10")
alert_Short   = input.bool(true, title = "MACD Cross Dn", group = "Alerts", inline="Alert10")
alert_Long_A  = input.bool(false, title = "MACD Cross Up & > 0", group = "Alerts", inline="Alert20")
alert_Short_B = input.bool(false, title = "MACD Cross Dn & < 0", group = "Alerts", inline="Alert20")
// Calculating
fast_ma = request.security(syminfo.tickerid, res, sma_source == "SMA" ? ta.sma(src, fast_length) : ta.ema(src, fast_length))
slow_ma = request.security(syminfo.tickerid, res, sma_source == "SMA" ? ta.sma(src, slow_length) : ta.ema(src, slow_length))
macd = fast_ma - slow_ma
signal = request.security(syminfo.tickerid, res, sma_signal == "SMA" ? ta.sma(macd, signal_length) : ta.ema(macd, signal_length))
hist = macd - signal
// MACD Trend and Cross Up/Down conditions
trend_up   = macd > signal
trend_dn   = macd < signal
cross_UP   = signal[1] >= macd[1] and signal < macd
cross_DN   = signal[1] <= macd[1] and signal > macd
cross_UP_A = (signal[1] >= macd[1] and signal < macd) and macd > 0
cross_DN_B = (signal[1] <= macd[1] and signal > macd) and macd < 0
// Condition that changes Color of MACD Line if Show Trend is turned on..
trend_col = show_trend  and trend_up ? col_trnd_Up : trend_up ? col_macd : show_trend  and trend_dn ? col_trnd_Dn: trend_dn ? col_macd : na 

//Var Statements for Histogram Color Change
var bool histA_IsUp = false
var bool histA_IsDown = false
var bool histB_IsDown = false
var bool histB_IsUp = false
histA_IsUp   := hist == hist[1] ? histA_IsUp[1] : hist > hist[1] and hist > 0
histA_IsDown := hist == hist[1] ? histA_IsDown[1] : hist < hist[1] and hist > 0
histB_IsDown := hist == hist[1] ? histB_IsDown[1] : hist < hist[1] and hist <= 0
histB_IsUp   := hist == hist[1] ? histB_IsUp[1] : hist > hist[1] and hist <= 0

hist_col =  histA_IsUp ? col_grow_above : histA_IsDown ? col_fall_above : histB_IsDown ? col_grow_below : histB_IsUp ? col_fall_below :color.silver 

// Plot Statements
//Background Color
bgcolor(show_cross and cross_UP ? col_trnd_Up : na, editable=false)
bgcolor(show_cross and cross_DN ? col_trnd_Dn : na, editable=false)
//Highlight Price Bars
barcolor(show_HB and trend_up ? col_trnd_Up : na, title="Trend Up", offset = 0, editable=false)
barcolor(show_HB and trend_dn ? col_trnd_Dn : na, title="Trend Dn", offset = 0, editable=false)
//Regular Plots
plot(show_Hist and hist ? hist : na, title="Histogram", style=plot.style_columns, color=color.new(hist_col ,0),linewidth=show_hist_LW)
plot(show_macd  and signal ? signal : na, title="Signal", color=color.new(col_signal, 0),  style=plot.style_line ,linewidth=show_signal_LW)
plot(show_macd  and macd ? macd : na, title="MACD", color=color.new(trend_col, 0),  style=plot.style_line ,linewidth=show_macd_LW)
hline(0, title="0 Line", color=color.new(color.gray, 0), linestyle=hline.style_dashed, linewidth=1, editable=false)
plot(show_dots and cross_UP ? macd : na, title="Dots", color=color.new(trend_col ,0), style=plot.style_circles, linewidth=show_dots_LW, editable=false)
plot(show_dots and cross_DN ? macd : na, title="Dots", color=color.new(trend_col ,0), style=plot.style_circles, linewidth=show_dots_LW, editable=false)

//Alerts
if alert_Long and cross_UP
    alert("Symbol = (" + syminfo.tickerid + ") TimeFrame = (" + timeframe.period + ") Current Price (" + str.tostring(close) + ") MACD Crosses Up.", alert.freq_once_per_bar_close)

if alert_Short and cross_DN
    alert("Symbol = (" + syminfo.tickerid + ") TimeFrame = (" + timeframe.period + ") Current Price (" + str.tostring(close) + ") MACD Crosses Down.", alert.freq_once_per_bar_close)
//Alerts - Stricter Condition - Only Alerts When MACD Crosses UP & MACD > 0 -- Crosses Down & MACD < 0
if alert_Long_A and cross_UP_A
    alert("Symbol = (" + syminfo.tickerid + ") TimeFrame = (" + timeframe.period + ") Current Price (" + str.tostring(close) + ") MACD > 0 And Crosses Up.", alert.freq_once_per_bar_close)

if alert_Short_B and cross_DN_B
    alert("Symbol = (" + syminfo.tickerid + ") TimeFrame = (" + timeframe.period + ") Current Price (" + str.tostring(close) + ") MACD < 0 And Crosses Down.", alert.freq_once_per_bar_close)


if (histA_IsUp)
	strategy.entry("buy", strategy.long, comment="buy")
if (histA_IsDown)
	strategy.entry("sell", strategy.short, comment="sell")