ダブル移動平均価格ジャンプ戦略

1
Follow
1779
Followers
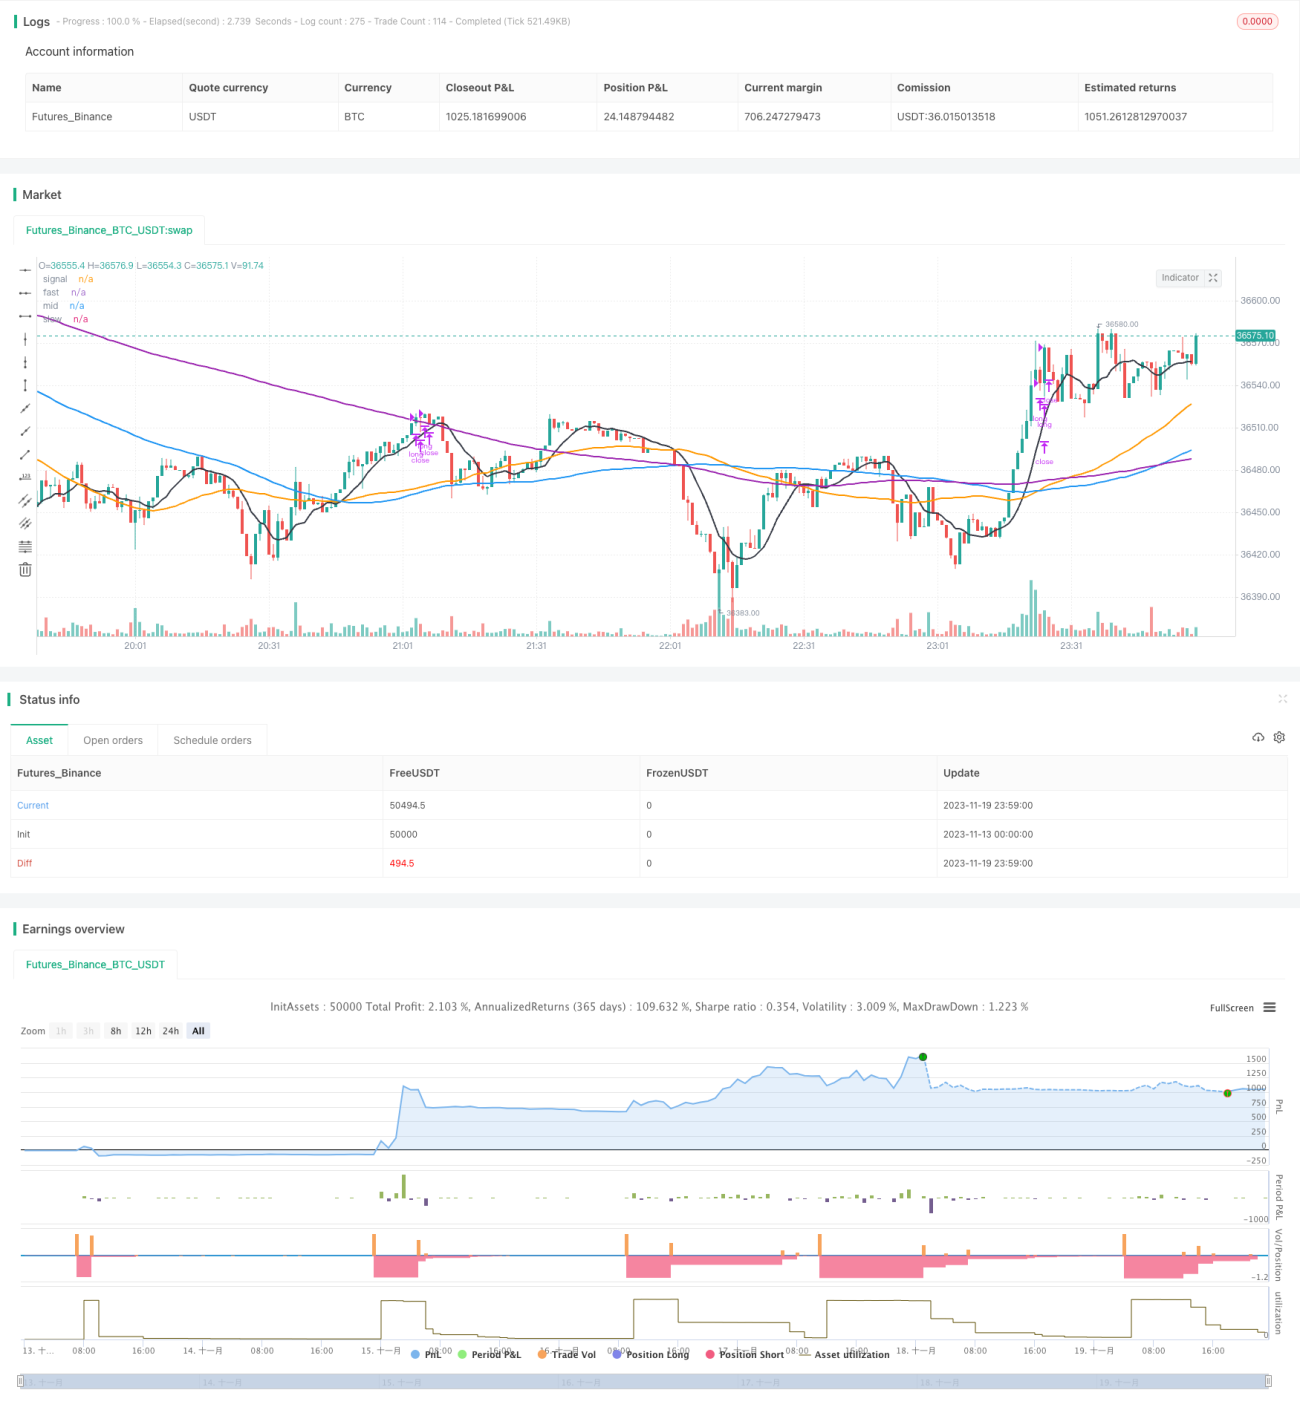
概要
この戦略は,RSI指数で超買いと超売りを判断し,快線,中線,慢線を組み合わせたトレンド判断システムで,価格が飛躍する時にポジションを空調にする機会を判断する.
戦略原則
- RSIで 超買いと超売りを判断する
- RSIパラメータは14周期に設定されています.
- 超売れ線は30で 超買い線は70です
- 3つの異なる周期のSMA平均線を用いたトレンド判断
- 9サイクルSMAの快線は短期トレンドを表しています.
- 中央線は50サイクルSMAで,中期トレンドを表しています.
- 慢線は200サイクルSMAで,長期トレンドを表しています.
-
RSIがオーバーセールしているときに,オフラインで中線を横切る.
-
線が中線を突破し,RSIがオーバーバイを示しているときに空白に入ります.
-
入場価格の4%に設定されたストップ・ロズ
-
利益を得る方法は,先ず20%を止めて,次に価格が上昇すると15%を止めて,順番にポジションを外すというものです.
優位分析
- 3つの異なる周期のSMA平均線を使用して,異なる時間帯のトレンドの変化を判断できます.
- RSIの利用は,超買超売の無い地域での取引を避けるために
- 配当の停止により,戦略的ポジション周期が増加し,平均ポジション収益も増加しました.
リスク分析
- 三つの均線が誤信号を発する確率
- <unk>の分批が完了しないリスクがある
- 価格変動が大きい株に適した株の種類を選択する
戦略最適化の方向性
- 平均線とRSIのパラメータをテストして変更し,入場と出場のチャンスを最適化できます.
- 戦略の正確性を高めるために,他の指標,例えば,フィルターキャンドルの形状を追加できます.
- ダイナミック・トラッキング・ストップ・ローズにより,リスクをさらにコントロールできます.
要約する
この戦略は,均線指標と超買い超売り指標RSIを組み合わせて,価格変化のトレンドを捉えながら同時に,買い売りの機会を判断する.これは,より一般的なトレンド追跡戦略の1つです.パラメータテストと他の補助判断指標を追加することで,戦略の勝利率をさらに最適化し,向上させることができます.
Source
Pine
Strategy parameters
Related strategies
Comment
All comments (0)
No data
- 1