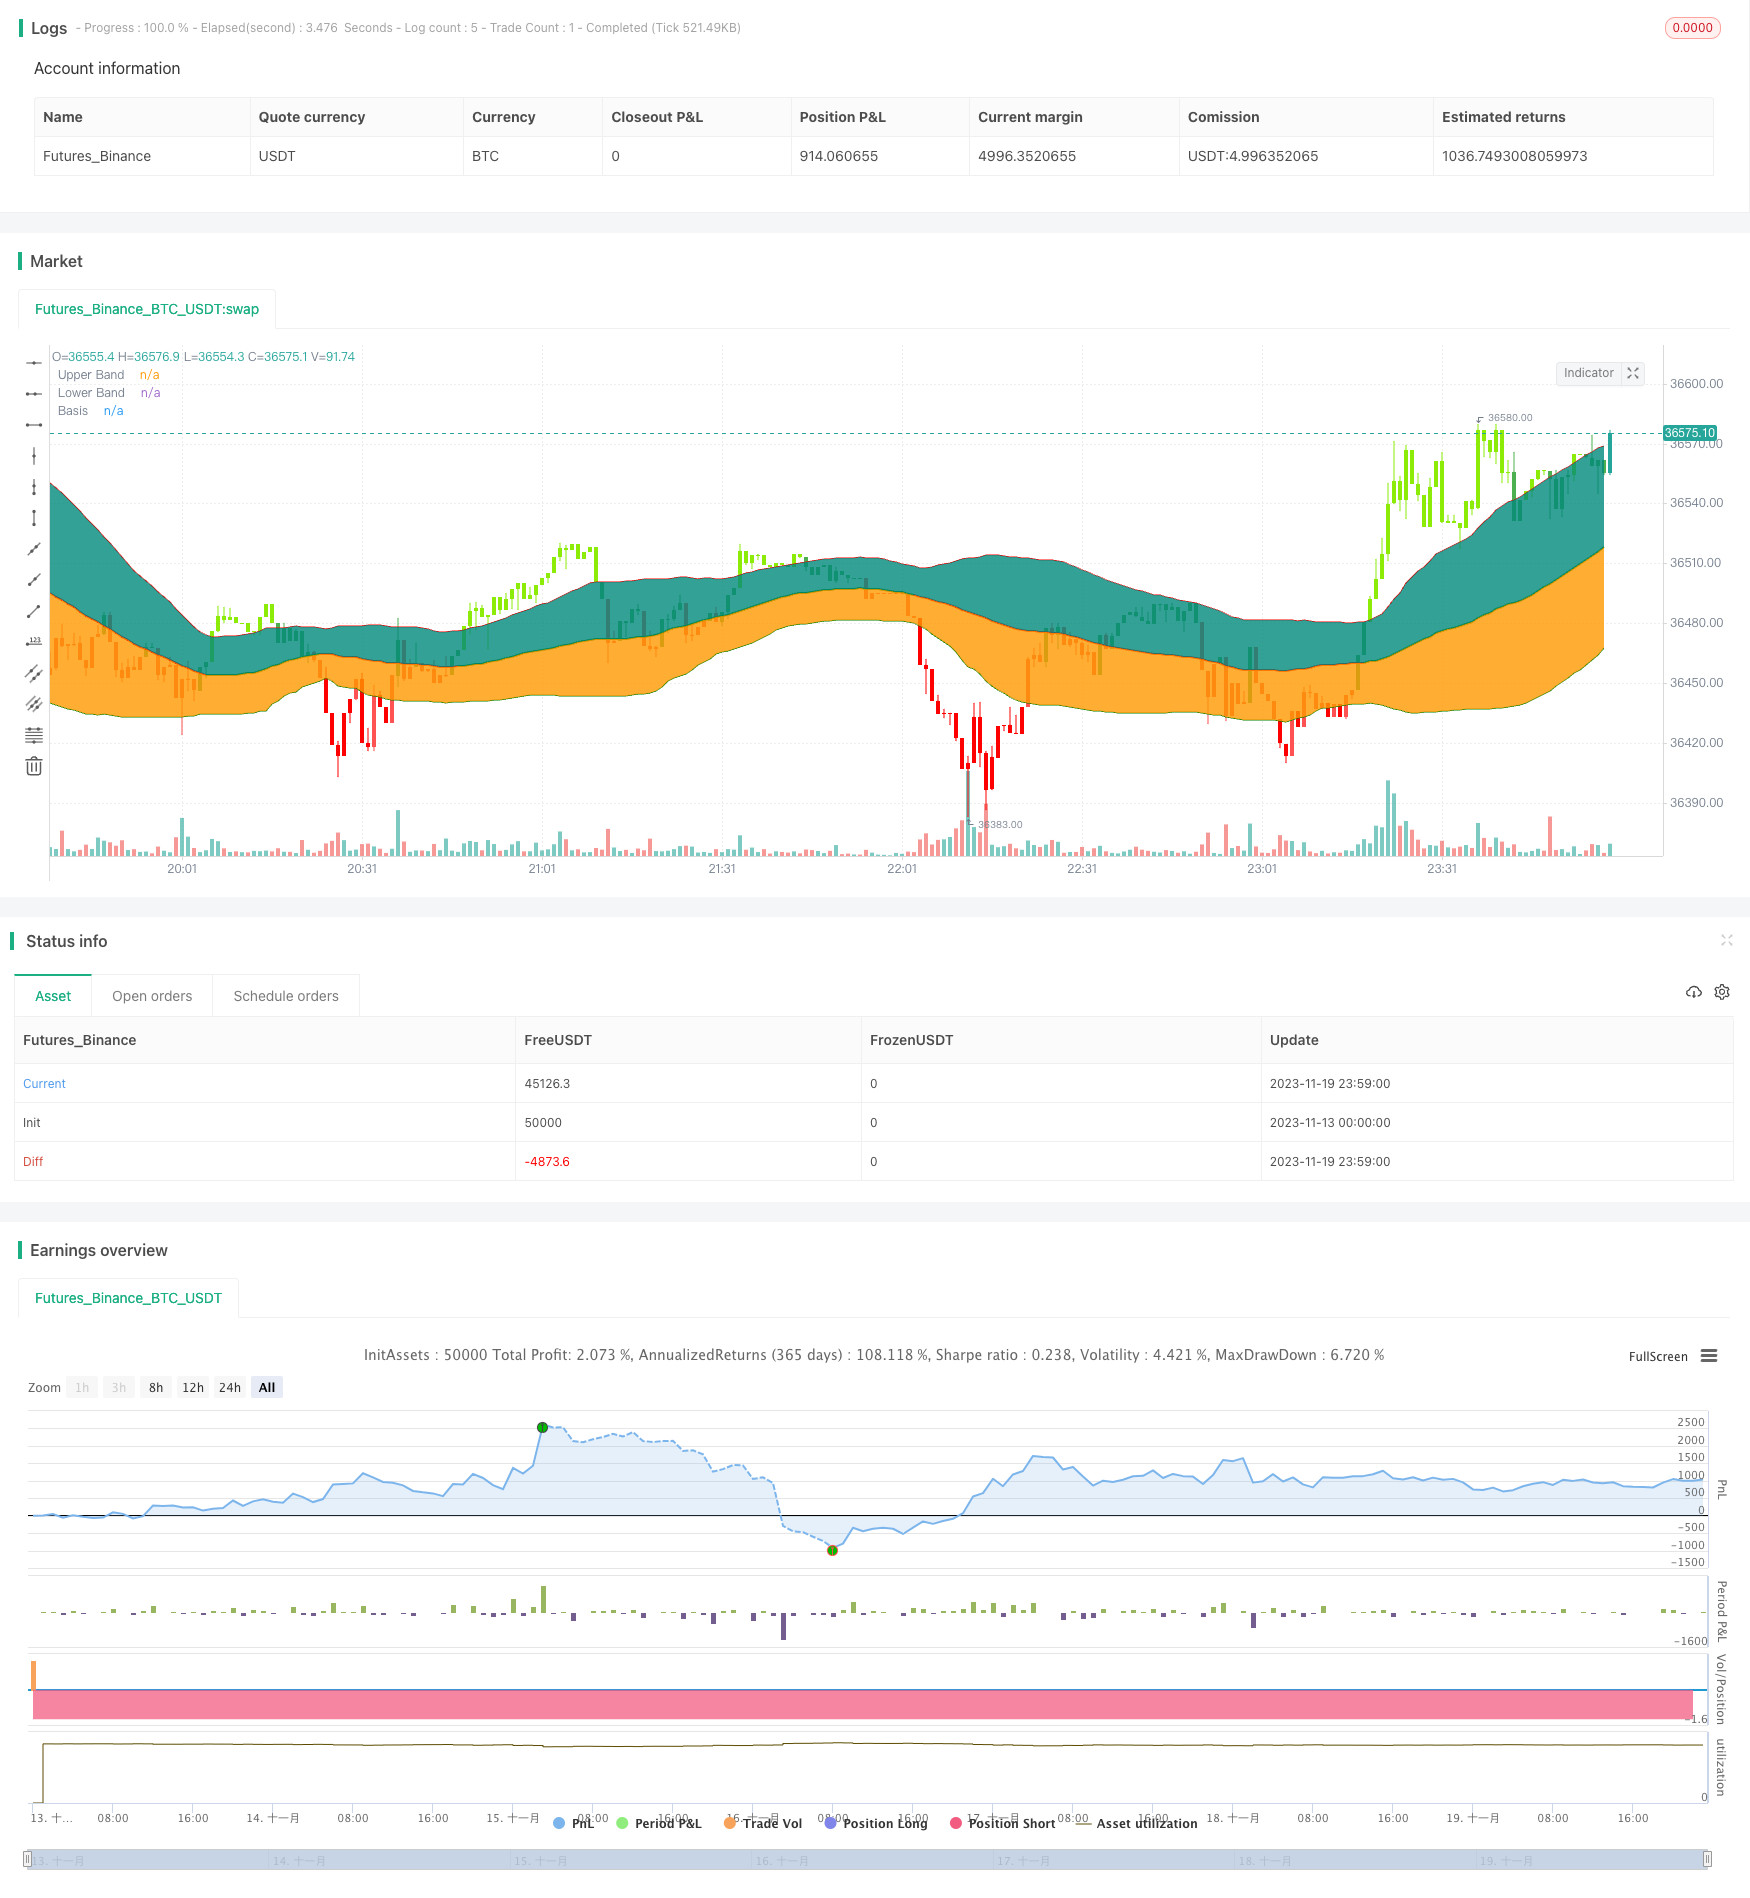
ボリンジャーバンド標準偏差ブレイクアウト戦略
作成日:
2023-11-21 17:14:04
最終変更日:
2023-11-21 17:14:04
コピー:
0
クリック数:
883
1
フォロー
1664
フォロワー

概要
この戦略は,クラシックなボリンジャー波帯指標に基づいており,価格収束が上線を突破するときに多めにし,価格収束が下線を突破するときに空白にし,トレンドを追跡する突破策の1つである.
戦略原則
- 基準線は55日間のSMAである.
- 上線と下線は,それぞれ基準線上の各基準差である.
- 価格の収束が軌道上を突破すると,多信号が発生する.
- 価格収束が下線を突破すると空白信号が生じる.
- 標準差の2倍というより標準差の2倍というリスクが低くなります.
優位分析
- 固定値ではなく標準差値を使用することでリスクが軽減されます.
- 55日移動平均は中期トレンドをよく表しています.
- 売り上げは破綻し,売り上げは破綻した.
- 複数のタイムサイクル分析により,トレンドの方向を容易に決定できます.
リスク分析
- 利子が揺れ動いたり
- 費用の影響を考慮する必要があります.
- 突破信号は偽突破かもしれない.
- 損失の滑り込みがあるかもしれない.
ストップ・ロスを設定し,取引手数料を考慮し,または指標フィルターを追加することでリスクを減らすことができます.
最適化の方向
- ベーキングラインのパラメータを最適化し,最適な平均線を探します.
- 最適化基準の差が大きいので,最適なパラメータを見つけます.
- 添加量価格指標などの補助判断.
- ストップ・ローズメカニズムを追加
要約する
この戦略の全体的な論理は明確で,標準差の帯域幅によってリスクを調整し,閉盘突破は偽突破を避ける.しかしながら,震動損失を防ぐことに注意する必要がある.これは,止損,フィルターを増やすなどによって最適化することができる.
ストラテジーソースコード
/*backtest
start: 2023-11-13 00:00:00
end: 2023-11-20 00:00:00
period: 1m
basePeriod: 1m
exchanges: [{"eid":"Futures_Binance","currency":"BTC_USDT"}]
*/

//@version=4

//┌───── •••• ─────┐//
//   TradeChartist  //
//└───── •••• ─────┘//

//Bollinger Bands is a classic indicator that uses a simple moving average of 20 periods along with upper and lower bands that are 2 standard deviations away from the basis line.
//These bands help visualize price volatility and trend based on where the price is in relation to the bands.

//This Bollinger Bands filter plots a long signal when price closes above the upper band and plots a short signal when price closes below the lower band.
//It doesn't take into account any other parameters such as Volume/RSI/fundamentals etc, so user must use discretion based on confirmations from another indicator or based on fundamentals.

//This filter's default is 55 SMA and 1 standard deviation, but can be changed based on asset type

//It is definitely worth reading the 22 rules of Bollinger Bands written by John Bollinger.


strategy(shorttitle="BB Breakout Strategy", title="Bollinger Bands Filter", overlay=true,
             pyramiding=1, currency=currency.NONE ,
             initial_capital = 10000, default_qty_type = strategy.percent_of_equity,
             default_qty_value=100, calc_on_every_tick= true, process_orders_on_close=false)

src         = input(close, title = "Source")
length      = input(55, minval=1, title = "SMA length")// 20 for classis Bollinger Bands SMA line (basis)


mult        = input(1., minval=0.236, maxval=2, title="Standard Deviation")//2 for Classic Bollinger Bands //Maxval = 2 as higher the deviation, higher the risk
basis       = sma(src, length)
dev         = mult * stdev(src,length)

CC          = input(true, "Color Bars")


upper       = basis + dev
lower       = basis - dev

//Conditions for Long and Short - Extra filter condition can be used such as RSI or CCI etc.

short       = src<lower// and rsi(close,14)<40
long        = src>upper// and rsi(close,14)>60

L1          = barssince(long)
S1          = barssince(short)

longSignal  = L1<S1 and not (L1<S1)[1]
shortSignal = S1<L1 and not (S1<L1)[1]

//Plots and Fills


////Long/Short shapes with text
// plotshape(S1<L1 and not (S1<L1)[1]?close:na, text = "sᴇʟʟ", textcolor=#ff0100, color=#ff0100, style=shape.triangledown, size=size.small, location=location.abovebar, transp=0, title = "SELL", editable = true)
// plotshape(L1<S1 and not (L1<S1)[1]?close:na, text = "ʙᴜʏ", textcolor = #008000, color=#008000, style=shape.triangleup, size=size.small, location=location.belowbar, transp=0, title = "BUY", editable = true)


// plotshape(shortSignal?close:na, color=#ff0100, style=shape.triangledown, size=size.small, location=location.abovebar, transp=0, title = "Short Signal", editable = true)
// plotshape(longSignal?close:na, color=#008000, style=shape.triangleup, size=size.small, location=location.belowbar, transp=0, title = "Long Signal", editable = true)


p1          = plot(upper, color=#ff0000, display=display.all, transp=75, title = "Upper Band")
p2          = plot(lower, color=#008000, display=display.all, transp=75, title = "Lower Band")


p           = plot(basis, color=L1<S1?#008000:S1<L1?#ff0000:na, linewidth=2, editable=false, title="Basis")


fill(p,p1, color=color.teal, transp=85, title = "Top Fill") //fill for basis-upper
fill(p,p2, color=color.orange, transp=85, title = "Bottom Fill")//fill for basis-lower


//Barcolor

bcol        = src>upper?color.new(#8ceb07,0):
             src<lower?color.new(#ff0000,0):
             src>basis?color.green:
             src<basis?color.red:na


barcolor(CC?bcol:na, editable=false, title = "Color Bars")


// //Alerts ----  // Use 'Once per bar close'

// alertcondition(condition=longSignal, title="Long - BB Filter", message='BB Filter Long @ {{close}}') // Use 'Once per bar close'
// alertcondition(condition=shortSignal, title="Short - BB Filter", message='BB Filter Short @ {{close}}')  // Use 'Once per bar close'

Notestart1 = input(true, "╔═══ Time Range to BackTest ═══╗")


// === INPUT BACKTEST RANGE ===
FromMonth = input(defval=1, title="From Month", minval=1, maxval=12)
FromDay = input(defval=1, title="From Day", minval=1, maxval=31)
FromYear = input(defval=2018, title="From Year", minval=2015)
ToMonth = input(defval=1, title="To Month", minval=1, maxval=12)
ToDay = input(defval=1, title="To Day", minval=1, maxval=31)
ToYear = input(defval=9999, title="To Year", minval=2010)

// === FUNCTION EXAMPLE ===
start = timestamp(FromYear, FromMonth, FromDay, 00, 00)  // backtest start window
finish = timestamp(ToYear, ToMonth, ToDay, 23, 59)  // backtest finish window
window() =>  // create function "within window of time"
    time >= start and time <= finish ? true : false

if(window())
    strategy.entry("Long", long=true, when =  longSignal)
    // strategy.close("Long", when = (short and S3==0), comment = "Close Long")

if(window())
    strategy.entry("Short", long=false, when = shortSignal)
    // strategy.close("Short", when = (long and L3==0), comment = "Close Short")