ダブル移動平均クロスオーバー反転戦略

1
Follow
1779
Followers
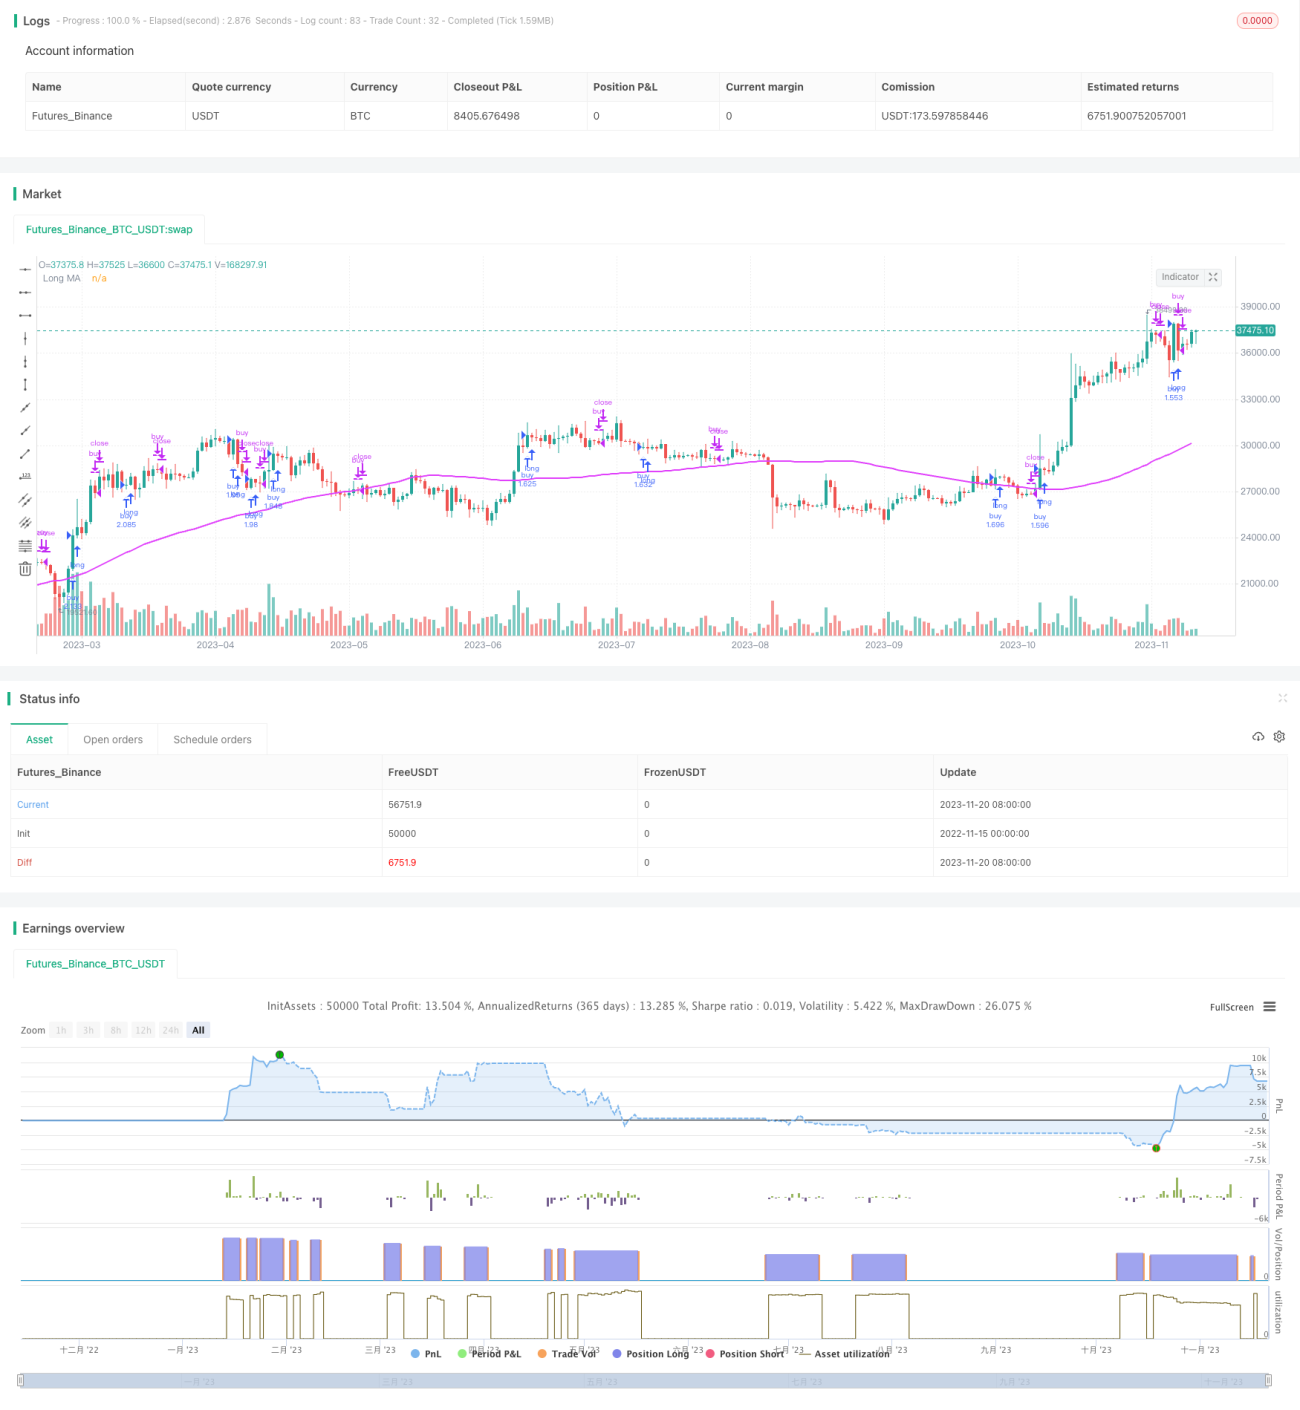
概要
この戦略の主な考えは,速い移動平均線と遅い移動平均線の交差を活用して市場のトレンドを判断し,短線と長い移動平均線が逆転したときに入場し,トレンドを追跡する効果を実現することである.
戦略原則
- 設定 急速移動平均線周期shortma (デフォルト 7 日) と 遅移動平均線周期longma (デフォルト 77 日)
- ショートラインが平均線上を長線を横切るときは買入信号として判断し, barssince ((mabuy)) と記録し,長線はトレンドへの入りを意味する. ショートラインが平均線下を長線を横切るときは売り信号として判断し, barssince ((masell)) と記録し,長線はトレンドの終了を意味する.
- barssinceの大きさを比較すると,短線平均線が上から下へと交差するバー数が多いほど,トレンドの持続期間が長くなる;逆に,短線平均線が下から上へと交差する<unk>数が多いほど,反転信号が強くなる.
- 売り信号のバー数が買信号のバー数より大きいときに買信号を発信する. 買信号のバー数が売り信号のバー数より大きいときに売信号を発信する
- such戦略は本質的に双均線の反転戦略であり,急速均線と遅い均線の反転によってトレンドの転換点を判断する.
戦略的優位性
- バイアスリーナリー判断で,部分的なノイズ取引信号をフィルターします.
- barssince比較を追加し,偽断ちとクローズ価格の反転による誤信号を回避する
- 簡単に理解し 実行できます
- 異なる周期と市場に適用できるカスタマイズ可能な移動平均線パラメータ
戦略リスク
- 双対一線戦略は,より多くのシグナルを生成しやすく,取引が頻繁に行われます.
- 移動平均線のパラメータを正しく設定しない場合,より長いトレンドのチャンスを逃す可能性があります.
- 長期平均線を突破すると,止まり点は遠く,大きな後退がある可能性があります.
- 市場を効率的にフィルターできない
戦略最適化の方向性
- 他の指標のフィルターを追加し,震動の状況に巻き込まれないようにする.
- 損失防止の強化
- 移動平均線参数组合を最適化する
- 市場周期の動向に調整された移動平均線パラメータ
要約する
この戦略は全体的に論理的にわかりやすく,急速な平均線と遅い平均線の逆転によって市場トレンドの転換点を判断し,理論的にはトレンドを効果的に追跡することができる.しかし,実用的には,戦略アルゴリズム自体とパラメータ設定を最適化して,より安定して実戦的にする必要がある.
Source
Pine
/*backtest
start: 2022-11-15 00:00:00
end: 2023-11-21 00:00:00
period: 1d
basePeriod: 1h
exchanges: [{"eid":"Futures_Binance","currency":"BTC_USDT"}]
*/

//@version=3
strategy("Up Down", "Up Down", precision = 6, pyramiding = 1, default_qty_type = strategy.percent_of_equity, default_qty_value = 99, commission_type = strategy.commission.percent, commission_value = 0.0, initial_capital = 1000, overlay = true)

buy = close > open and open > close[1]Strategy parameters
Related strategies
Comment
All comments (0)
No data
- 1