ボリンジャーバンドのゴールデンクロスとデッドクロス戦略

1
Follow
1779
Followers
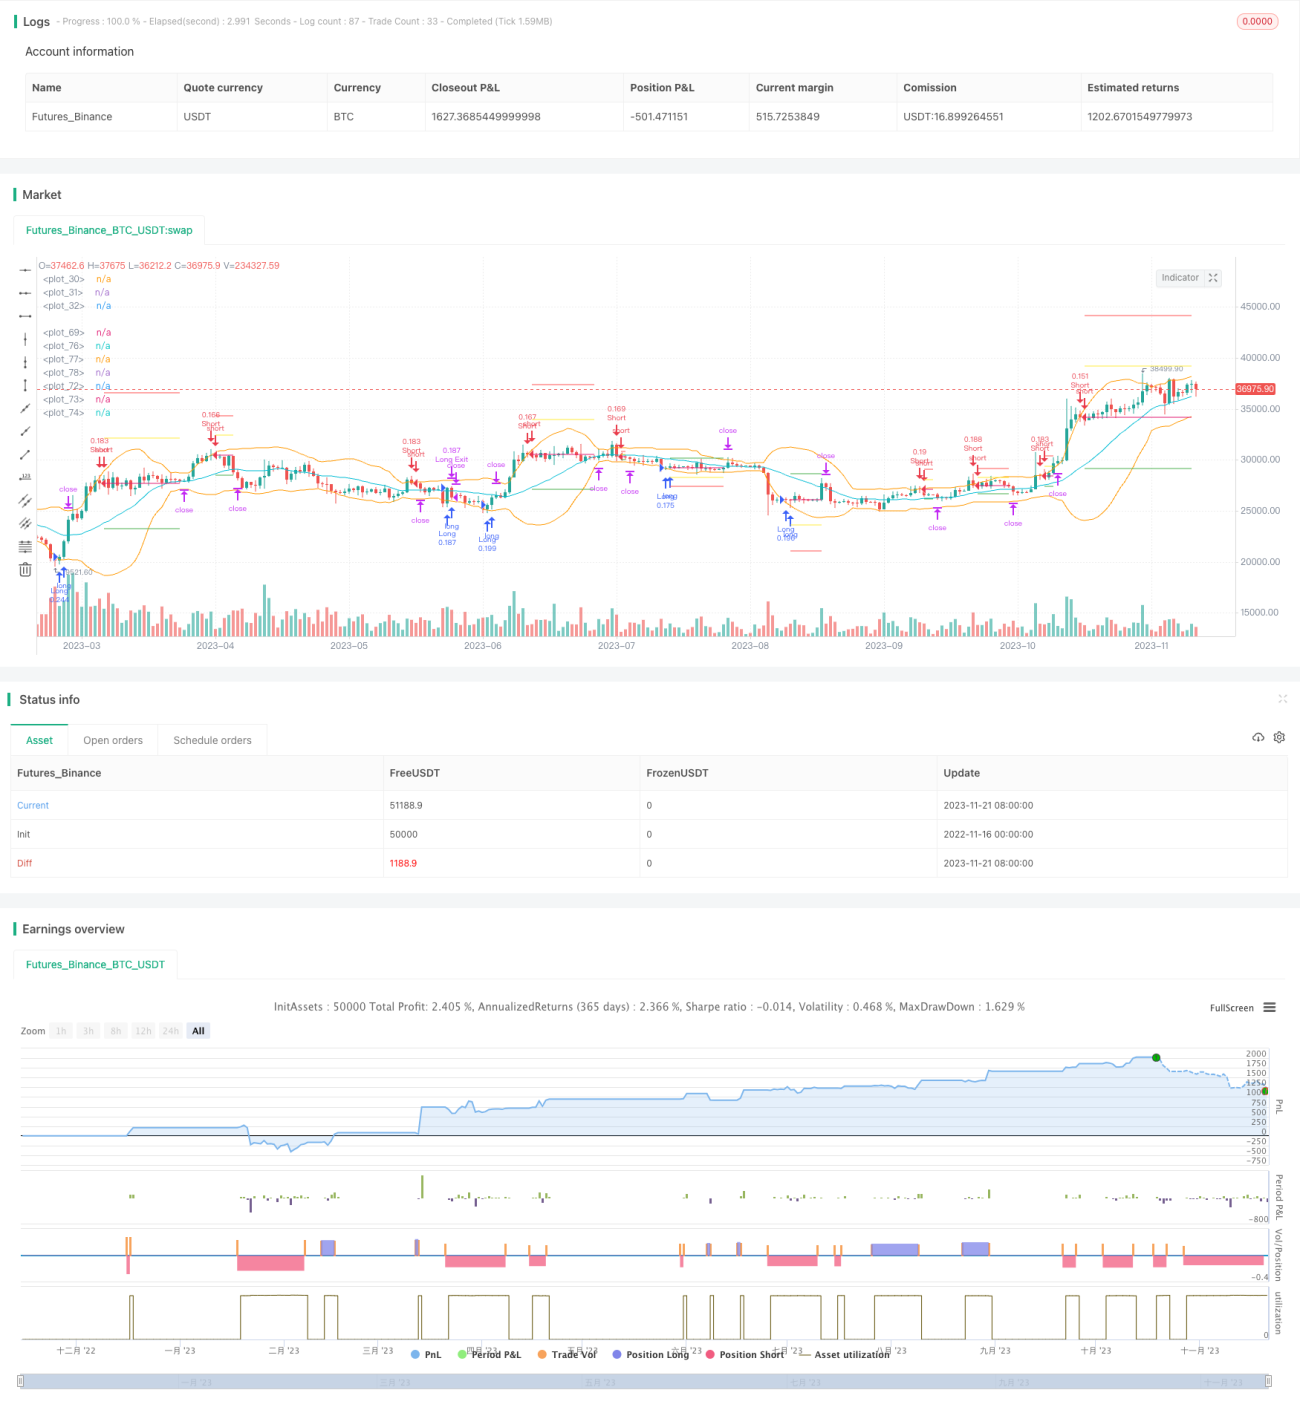
概要
この戦略は,ブリン帯の金叉死叉に基づく多空の策である.価格がブリン帯を突破して上線したとき,空白する.価格がブリン帯を突破して下線したとき,多空する.ポジション保持期間中は,加仓とストップ損失追跡が行われる.
戦略原則
この戦略は,ブリン帯の上下3つの軌道を用いる.ブリン帯の中央軌道はn日の移動平均で,上軌道は中軌道の+k倍のn日の標準差で,下軌道は中軌道の-k倍のn日の標準差である.nは一般的に20であり,kは一般的に2である.
価格が上から下を突破すると,価格が上昇し始めたことを示す,このとき,多めに;価格が上から下を突破すると,価格が下を突破し始めたことを示す,このとき,空きをする.
負債の引き上げは,すでに保有しているポジションに基づいて行われ,価格が再び平均線に触れた場合,再び負債の引き上げまたは空白を行う.
すべての保有者のストップ・トラッキングもリアルタイムで更新されます.ストップ・ラインは,現在の保有者の平均価格とブリン帯価格の差値に基づいて設定されます.
優位分析
この戦略の利点は以下の通りです.
- ブリン帯の指数を使って,価格の突破を捉え,多空を正確に行う
- 黄金叉死叉法による入院の規則化
- 投資家は,投資先の利益を得るために,投資先の利益を増やすことができます.
- ストップダメージをリアルタイムで更新し,ストップダメージが衝撃を受けないようにします.
リスク分析
この戦略にはいくつかのリスクがあります.
- ブリン・バンドは市場変動に敏感で,利回りになりかねない指標である.
- 投資はリスクの拡大に繋がり,損失は拡大される
- ストップダメージラインは絶対的ではないが,隠された可能性もある.
これらのリスクに対して,以下のように最適化できます.
- ブリン帯のパラメータを異なる周期に対応するように調整する
- ポジションの幅と頻度を最適化する
- 中央線を追加し,さらなる止損線となる.
最適化の方向
この戦略は以下の点で最適化できます.
- ブリン帯のパラメータを最適化し,より多くの市場環境に適応する
- リスクとリターンのバランスをとる
- 中道停止などの止損線を増やす
- 予防策を増やし,予防策を積極的に取ろう
- 他の指標と組み合わせた入場時刻をフィルターする
- 資金管理の最適化と単一リスクの管理
要約する
この戦略は,全体として典型的なトレンド追跡戦略である。それは順番を踏まえて,トレンドが発生したときに利益を得ることができる。同時に,ある程度のリスクも伴う.さらなる最適化と改善が必要であり,より多くの市場状況に適応し,偽突破によるリスクを減らす必要がある。
Source
Pine
/*backtest
start: 2022-11-16 00:00:00
end: 2023-11-22 00:00:00
period: 1d
basePeriod: 1h
exchanges: [{"eid":"Futures_Binance","currency":"BTC_USDT"}]
*/

//@version=5

strategy(title='Bollinger Band strategy with split, limit, stop', shorttitle='bb strategy', overlay=true,commission_type = strategy.commission.percent, commission_value = 0.01, default_qty_type = strategy.percent_of_equity, default_qty_value = 10, pyramiding = 4)
Strategy parameters
Related strategies
Comment
All comments (0)
No data
- 1