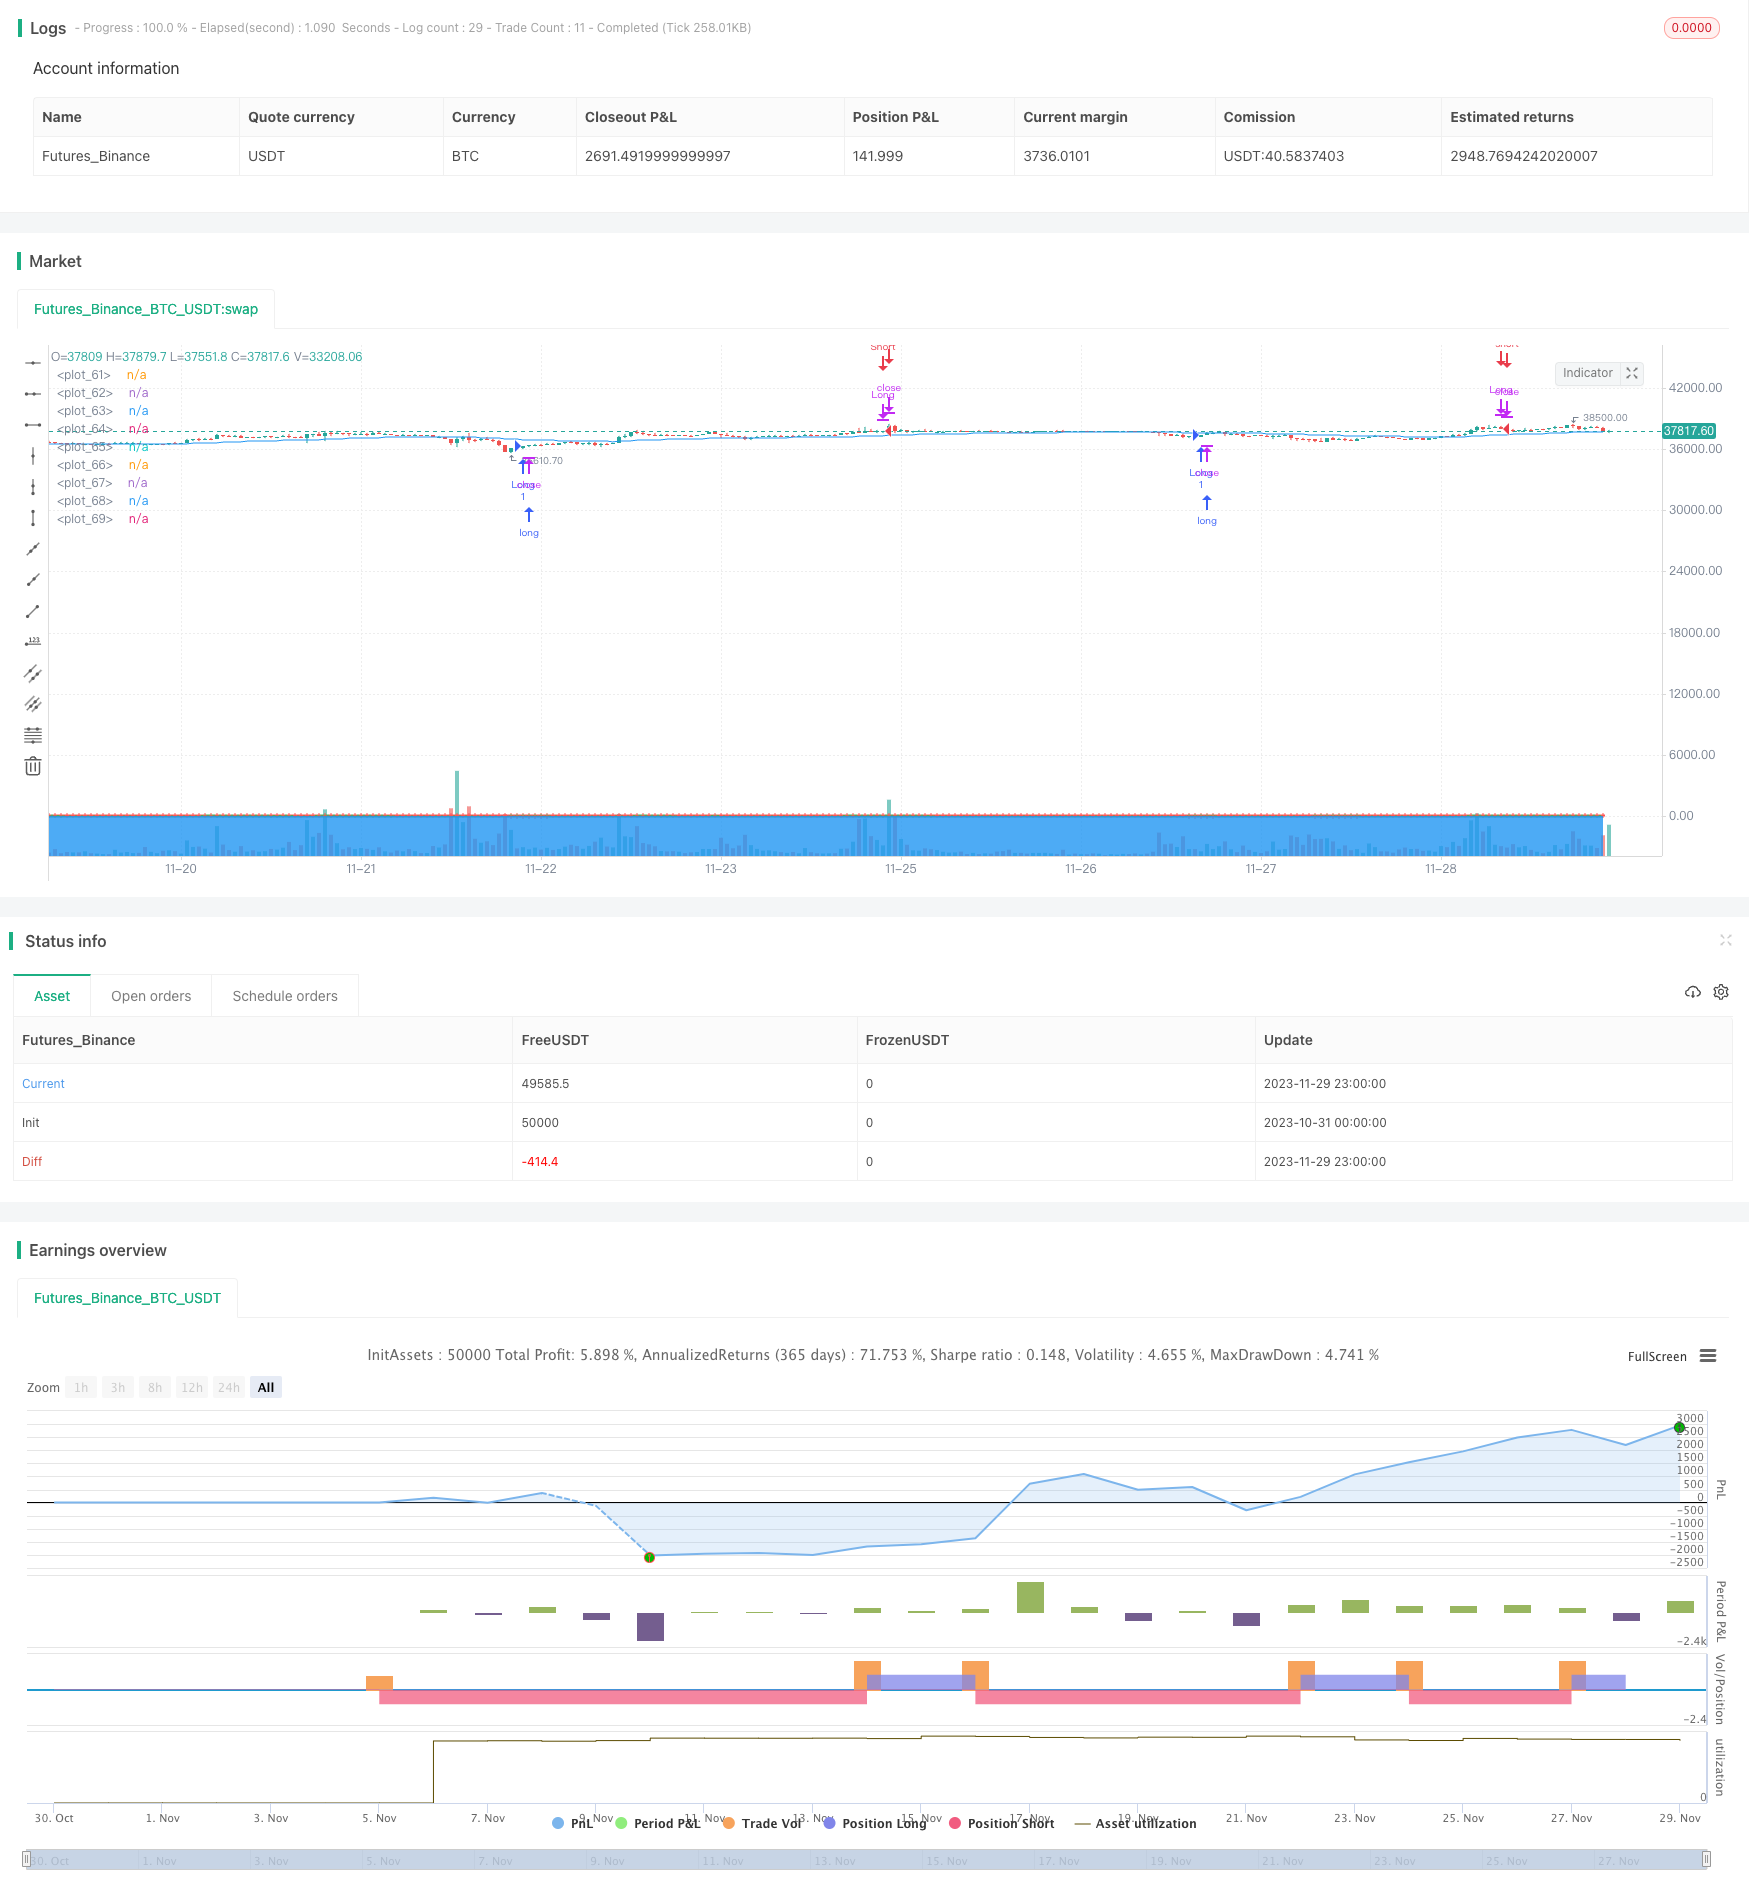
波動トレンドの複数のストップロスと複数のテイクプロフィット戦略
作成日:
2023-12-01 18:09:12
最終変更日:
2023-12-01 18:09:12
コピー:
2
クリック数:
888
1
フォロー
1664
フォロワー

概要
この戦略は,LazyBearの原始的な波動トレンド戦略であり,第二のストップ,複数のストップ価格,および高時間枠EMAフィルターを追加した.これは,波動トレンド指標を利用して取引信号を生成し,EMAフィルタリングとストップストップ管理を組み合わせて,トレンド追跡を自動化する取引を実現する.
戦略原則
戦略の核心指標は波動傾向指標であるWaveTrendで,以下の3つの部分から構成されています.
AP:平均価格= (最高価格+最低価格+閉店価格) /3
ESA:APのn1期EMA
CI: ((AP-ESA) / (0.015×AP-ESAのn期EMA) の絶対値のn期EMA
TCI:CIのn2期EMA,すなわち波動トレンドライン1 ((WT1))
WT2:WT1の4周期SMA
WT1上を貫通するとWT2が金叉を生じると,多めにする.WT1下を貫通するとWT2が死叉を生じると,平仓する.
さらに,戦略は,高時間枠EMAをフィルターとして導入し,価格がEMAより高いときにのみ多量化され,EMAより低いときに空きをするようにして,部分的な偽信号をフィルターします.
戦略的優位性
- 波動のトレンド指数を使って自動でトレンドを追跡し,人為的な判断の誤りを回避します.
- 2番目のストップを追加し,単一損失を効果的に制御します.
- 複数のストップ価格で最大利益を確保する
- EMAフィルター,偽信号をフィルターし,勝利率を上げる
リスクと最適化
- フィルタリングができない場合,損失を招く可能性があります.
- パラメータの設定を間違えた場合,取引が頻発する可能性があります.
- 異なるパラメータの組み合わせをテストし,パラメータを最適化
- 他の指標と組み合わせた場合,トレンドの逆転を考慮する
要約する
この戦略は,トレンド追跡,リスク管理,利益最大化などの複数の次元を総合的に考慮し,波動トレンド指標によってトレンドを自動捕捉し,EMAフィルターと連携して取引効率を向上させ,トレンドを把握しながらリスクを制御する,高効率で安定したトレンド追跡戦略である.さらなるパラメータの最適化と反転判断の追加により,この戦略の適用性をさらに拡張することができる.
ストラテジーソースコード
/*backtest
start: 2023-10-31 00:00:00
end: 2023-11-30 00:00:00
period: 1h
basePeriod: 15m
exchanges: [{"eid":"Futures_Binance","currency":"BTC_USDT"}]
*/

// This source code is subject to the terms of the Mozilla Public License 2.0 at https://mozilla.org/MPL/2.0/
// © undacovacobra

//@version=4
strategy("WaveTrend Strategy [LazyBear] with Secondary Stop Loss", overlay=true)

// Input parameters
n1 = input(10, "Channel Length")
n2 = input(21, "Average Length")
obLevel1 = input(60, "Over Bought Level 1")
obLevel2 = input(53, "Over Bought Level 2")
osLevel1 = input(-60, "Over Sold Level 1")
osLevel2 = input(-53, "Over Sold Level 2")
useEmaFilter = input(false, "Use EMA Filter")
emaLength = input(50, "EMA Length")
emaTimeFrame = input("60", "EMA Time Frame")
tradeMode = input("Both", "Trade Mode", options=["Long Only", "Short Only", "Both"])
useSecondarySL = input(false, "Use Secondary Stop Loss")
slPercentage = input(5.0, "Stop Loss Percentage (%)")

// WaveTrend Indicator Calculations
ap = hlc3
esa = ema(ap, n1)
d = ema(abs(ap - esa), n1)
ci = (ap - esa) / (0.015 * d)
tci = ema(ci, n2)
wt1 = tci
wt2 = sma(wt1, 4)

// EMA Calculation with Selected Time Frame
getEma(timeFrame) =>
    security(syminfo.tickerid, timeFrame, ema(close, emaLength))

emaFilter = getEma(emaTimeFrame)

// Secondary Stop Loss Calculation
longStopPrice = strategy.position_avg_price * (1 - slPercentage / 100)
shortStopPrice = strategy.position_avg_price * (1 + slPercentage / 100)

// Long Entry and Exit Conditions with EMA Filter and Trade Mode
longEntry = crossover(wt1, wt2) and wt2 < osLevel1 and (not useEmaFilter or close > emaFilter) and (tradeMode == "Long Only" or tradeMode == "Both")
if (longEntry)
    strategy.entry("Long", strategy.long)
longExit = crossunder(wt1, wt2) and wt2 > obLevel1
if (longExit)
    strategy.close("Long")
if (useSecondarySL and strategy.position_size > 0 and low < longStopPrice)
    strategy.close("Long", comment="SL Hit")

// Short Entry and Exit Conditions with EMA Filter and Trade Mode
shortEntry = crossunder(wt1, wt2) and wt2 > obLevel1 and (not useEmaFilter or close < emaFilter) and (tradeMode == "Short Only" or tradeMode == "Both")
if (shortEntry)
    strategy.entry("Short", strategy.short)
shortExit = crossover(wt1, wt2) and wt2 < osLevel1
if (shortExit)
    strategy.close("Short")
if (useSecondarySL and strategy.position_size < 0 and high > shortStopPrice)
    strategy.close("Short", comment="SL Hit")

// Plotting
plot(0, color=color.gray)
plot(obLevel1, color=color.red)
plot(osLevel1, color=color.green)
plot(obLevel2, color=color.red, style=plot.style_cross)
plot(osLevel2, color=color.green, style=plot.style_cross)
plot(wt1, color=color.green)
plot(wt2, color=color.red, style=plot.style_cross)
plot(wt1-wt2, color=color.blue, style=plot.style_area, transp=80)
plot(emaFilter, color=color.blue)