価格内部変動チャネルに基づく強気と弱気の戦略

概要
この戦略は,価格の内部チャネルを使用して将来の価格動きを判断し,トレンド追跡戦略に属します.価格が一定数の内部価格波動チャネルを形成するときに,トレンド転換信号として判断し,買取または販売操作を行います.移動平均フィルターとストップ損失ストップの設定を組み合わせて利益をロックし,より一般的な定量取引戦略に属します.
戦略原則
この策略は,前後2つのK線の最高価格と最低価格の大きさの関係によって内部通路の形成を判断する.一定数のK線が,最高価格が前K線の最高価格より低い,最低価格が前K線の最低価格より高い条件を満たす場合に,価格の内部通路と判断する.
価格の内部通路の形成を判断すると同時に,戦略は,その内部通路の方向も判断する.看板の内部通路であれば,買入シグナルを生じ,看板の内部通路であれば,売出シグナルを生じする.したがって,この戦略は双方向取引戦略の類である.
偽の信号をフィルターするために,この戦略は移動平均指標も導入した.価格が移動平均以上または以下である場合にのみ,実際の取引シグナルが生成される.これは,市場を整頓する際に誤った取引を一定程度に防ぐことができる.
入場後,戦略はまた,ユーザーの選択に応じて,ストップ損失の停止ポイントを設定する.選択可能な停止方法は3種類あります:固定ポイントの停止,ATRの停止,前期最高最低ポイントの停止.ストップポイントの設定は,リスク・リターン比率の停止である.これは,利益を一定程度にロックし,リスクを制御することができます.
優位分析
この戦略の最大の優点は,トレンドの転換点を識別する能力の強さにある.価格が一定数の内部通路を形成すると,多くの場合,大きな下落が起ころうとしていることを示唆する.この判断は,伝統的な技術分析理論と高度に一致する.
また,戦略自体は非常に構成可能である.ユーザーは,内部チャネルの数,移動平均周期,止損停止方法などのパラメータを自由に選択することができる.これは,異なる品種,異なる取引スタイルに大きな柔軟性を提供します.
最後に,戦略に付加された移動平均のフィルターとストップ・ストップの設定も,取引リスクを大幅に軽減しています.これは,戦略をあらゆる種類の市場環境の取引に適用できるようにしています.
リスク分析
この策略の最大のリスクは,トレンド判断に誤りが生じる可能性が高いことである.内部チャネルは価格逆転を完全に決定することができないので,誤判の可能性はある.確定した数が不足すると,偽信号が生じる可能性がある.
さらに,整合や振動の市場では,この戦略はまったく適用されません.価格が上下波動するが,トレンドが確立されていない場合,この戦略は誤った信号を連続的に発生します.これは戦略のメカニズムによって決定されます.
最後に,ストップ・ロスの設定が保守的すぎると,戦略が十分な長期間保持できず,大きなトレンドの利益を捕捉することができません.これはユーザーの自己バランス設定を必要とします.
最適化の方向
この戦略の最適化の余地はある.いくつかの可能な最適化の方向は以下の通りです.
-
内部チャネルの数と形状を最適化します. 異なる数または異なる配列の組み合わせの下で取引の効果をテストできます.
-
移動平均の周期パラメータを最適化して,トレンドの方向性をよりよく判断できるようにする.現在のデフォルト周期は,すべての品種に適していない可能性があります.
-
他の指標フィルターを追加する.例えば,ブリン帯を導入し,価格がブリン帯を突破して上線または下線するときにのみ取引シグナルを生成する.
-
ストップ・ストップ・パラメータの最適化により,戦略はより長い期間でポジションを保持することができ,スーパートレンドの利益を捕獲できます.
全体として,この戦略は,トレンド判断の正確さによって存在している.判断の正確さを保証できれば,適切なリスク管理の設定に付加されれば,より効果的なアルゴリズム取引を行うことができます.
要約する
この戦略は,全体として,価格の内部通路に基づいて将来の価格動向を判断する量化取引戦略である.それは,トレンド追跡とトレンド反転の2つの判断方法を組み合わせて,一定の優位性を持っている.しかし,いくつかの最適化可能なスペースも存在し,投資家は,特定の品種と取引環境に合わせて,自分のニーズに応じて調整することができます.この戦略は,パラメータの最適化後に,非常に理想的な量化取引戦略の1つになる可能性があります.
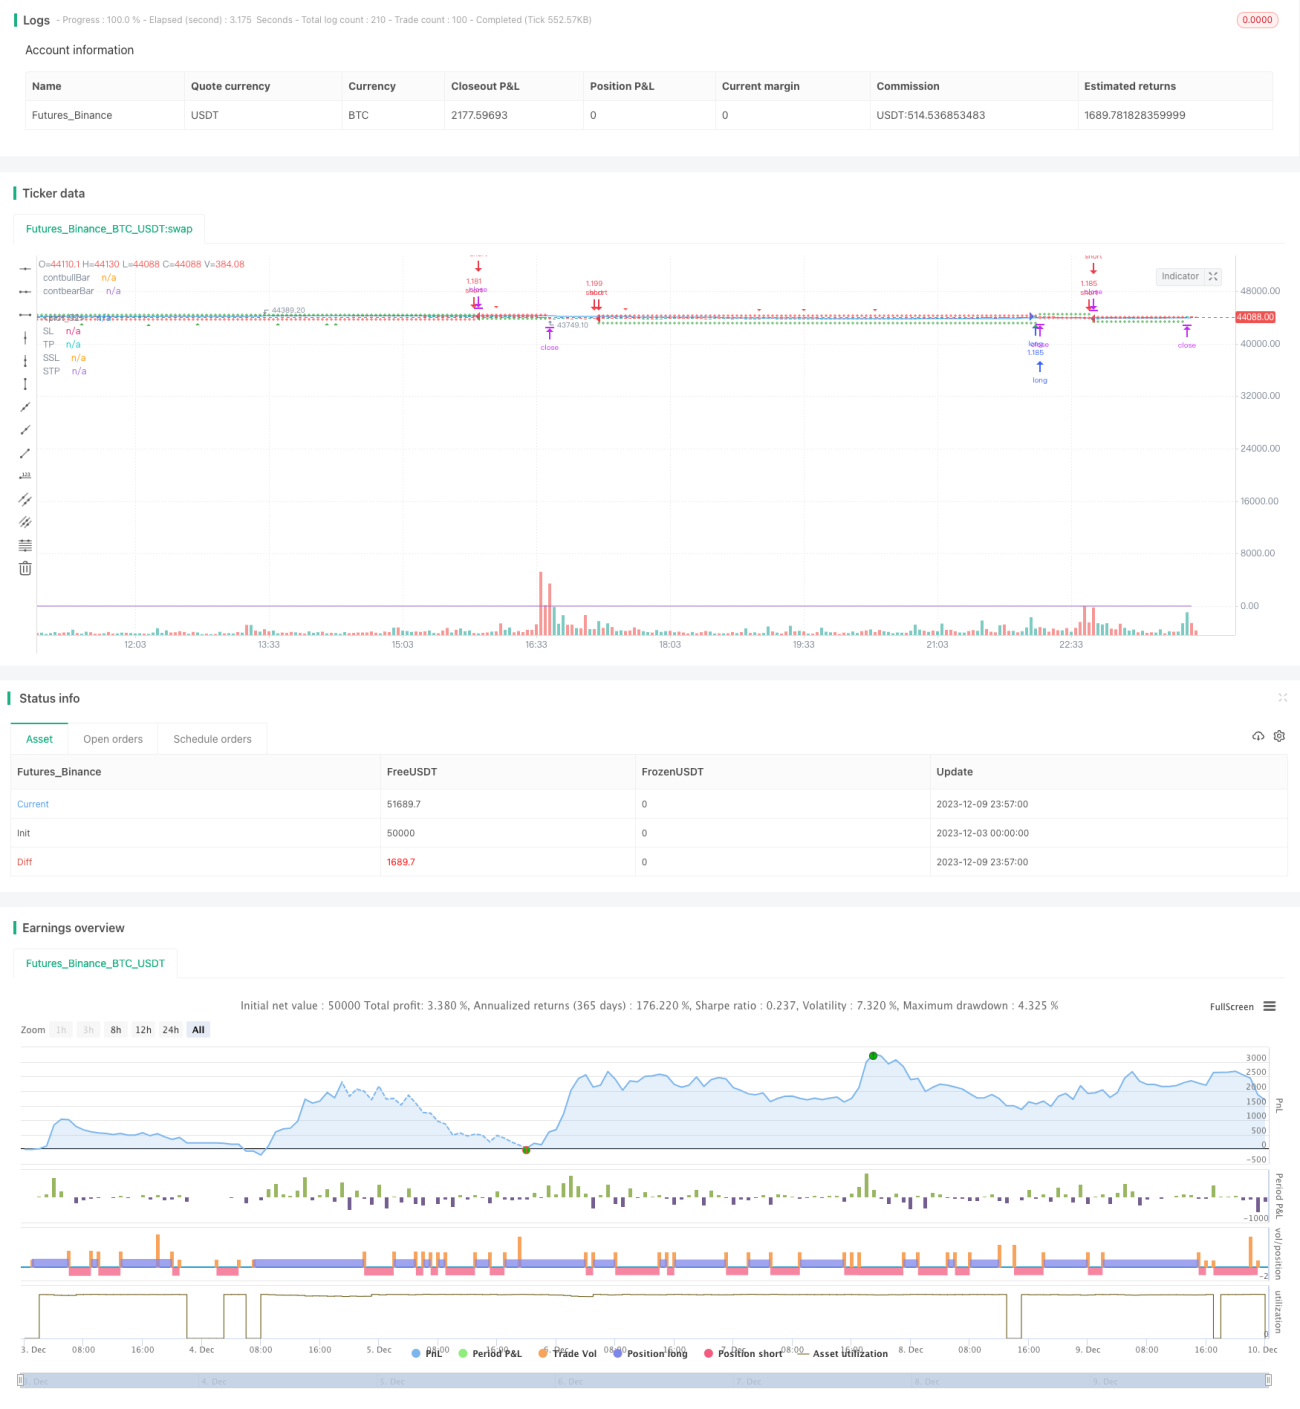
/*backtest
start: 2023-12-03 00:00:00
end: 2023-12-10 00:00:00
period: 3m
basePeriod: 1m
exchanges: [{"eid":"Futures_Binance","currency":"BTC_USDT"}]
*/

// This source code is subject to the terms of the Mozilla Public License 2.0 at https://mozilla.org/MPL/2.0/

// From "Day Trading Cryptocurrency
// Strategies, Tactics, Mindset, and Tools Required To Build Your - 1