
多因子自己適応動量追跡戦略は,複数の技術指標を統合して市場の傾向と重要なサポートの抵抗点を識別し,暗号通貨などの高変動資産の自動取引を実現する.この戦略は,RSI,MACD,Stochasticなどの指標を総合的に使用して,買入のタイミングを判断し,価格変化のパーセントと組み合わせて,より正確な形状識別を実現する.
多因子自己適応動量追跡戦略の核心は,複数の技術指標の整合的な使用である.この戦略は,主に以下のいくつかの構成要素を使用する.
RSI指標は,超買超売を判断する.異なるパラメータを組み合わせて,通常のRSI信号または改良版のコーナーRSI信号を識別して,逆転の機会があるかどうかを判断することができる.
MACD指数は,トレンドの方向を判断するのに役立ちます. MACDが信号線を横切ったり横切ったりすると,買ったり売ったりするシグナルが生じます.
ストキャスティック指標は,超買い超売り領域を識別する。K線とD線の金叉死叉組合せ信号が逆転するかどうかを判断する。
価格変化のパーセントは,本当の突破であるかどうかを検査する.特定の周期内の最高価格,最低価格,閉店価格などの変化のパーセントを計算して,本当の突破であるかどうかを判断する.
EMA指標は,大レベルの多空を判断する.快線を横切るのが看板信号で,下を横切るのが下向き信号である.
この戦略は,市場の空白状態に応じて多額の空白を選択し,ポジションに入った後にストップ・ストローを設定し,リスクを効果的に制御する.反転信号が現れたときに平仓をオフに選択する.全意思決定プロセスは,複数の要因の判断を充分に組み合わせ,より正確な判断を実現する.
この戦略の利点は以下の通りです.
多因子駆動は判断上の優位性を持っています.単一の指標と比較して,複数の指標の組み合わせが相互に検証でき,結果をより正確かつ信頼性があり,不必要な取引コストを削減します.
条件 厳格に誤取引を避ける. 戦略は,取引条件に厳格な要求を設定し,複数の指標が同時に信号を放出する必要があり,それによって大量のノイズをフィルターして誤取引の発生を防ぐことができます.
超パラメータの自在適応は人工の干渉を軽減する. 策略の内蔵の動的に指標パラメータを計算する能力は,人工の選択超パラメータの主観性を回避し,その結果,策略Parametersをより科学的に客観的にする.
ストップ・ストップ・メカニズム リスク制御 戦略は,ポジション開設後にストップ・ストップの位置をリアルタイムで計算し,描画し,単一損失を効果的に制御し,ポジションの破綻を防ぐ.
この戦略にはいくつかのリスクがあります.
指標誤差信号の発生確率。多指標検証により誤差信号の発生率が大幅に削減できるが,発生する可能性はある。これは不必要な損失を引き起こす可能性がある。
ストップが突破されるリスク.極端な状況では,価格が崖っぷちに下がり,元のストップが簡単に突破され,大きな損失が発生する可能性があります.
パラメータ最適化による過最適化.動的パラメータは,人工選択による主観性を避けているが,パラメータ過最適化によって一般化能力を失う可能性がある.
対応方法:
マルチファクター自己適応動量トラッキング策には以下のいくつかの最適化可能な次元がある.
判断要素の数を増やす. 変動率,取引量などの補助判断など,より多くの異なるタイプの指標信号判断と組み合わせる.
ストップメカニズムの最適化アルゴリズム. ストップトラッキングやストップ振動などのより高度なストップアルゴリズムを導入して,さらにストップが突破される確率を低下させることができる.
機械学習モデルを導入する.RNN,LSTMなどのモデルを使用して,歴史的データをモデル化して,購入や売却の判断を補助する.
戦略統合 複数の子戦略を採用し,統合学習の方法を使用して統合することで,より安定した総合的なパフォーマンスを得ることができる.
多因子自己適応動量トラッキング戦略は,複数の技術指標を統合して取引のタイミングを特定する.単一の指標と比較して,この戦略の判断はより正確であり,また,自律的自己適応と止損メカニズムのリスク制御の組み込みパラメータがある.次のステップは,より多くの補助的判断因子,高度な止損アルゴリズム,機械学習などの方法を導入することによって,この戦略の効果をさらに強化することができる.
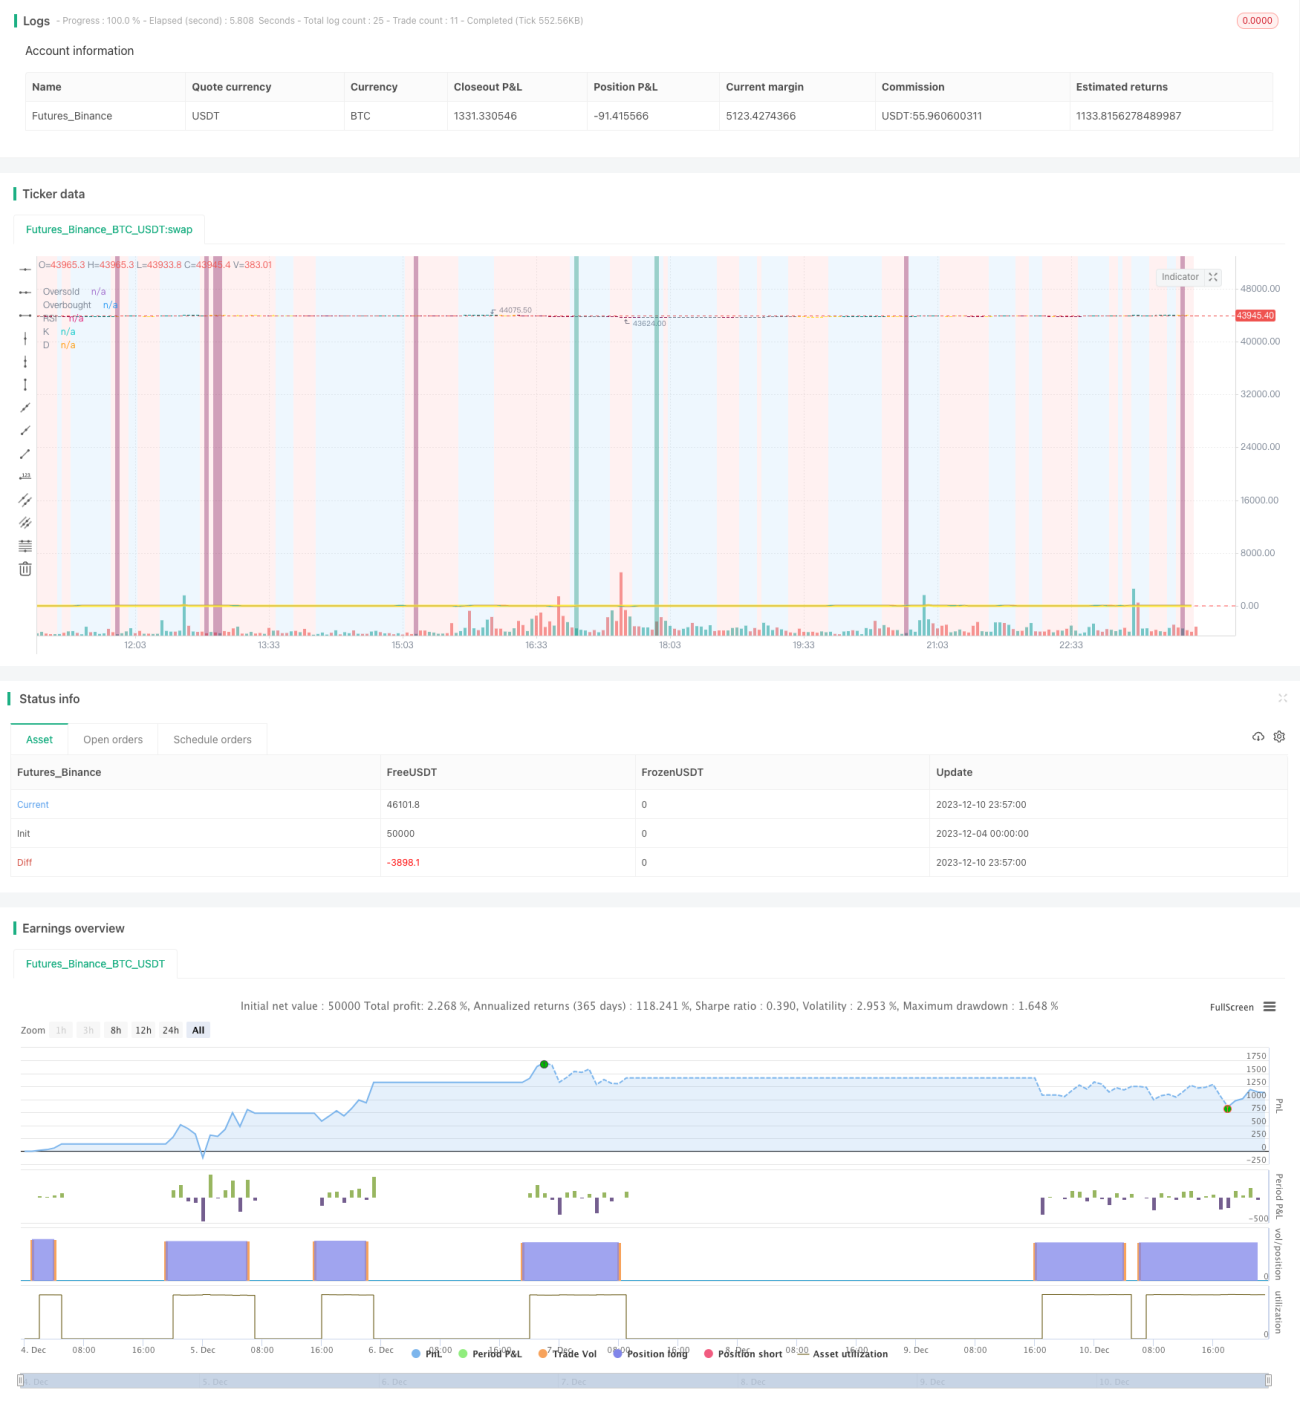
/*backtest
start: 2023-12-04 00:00:00
end: 2023-12-11 00:00:00
period: 3m
basePeriod: 1m
exchanges: [{"eid":"Futures_Binance","currency":"BTC_USDT"}]
*/
// This source code is subject to the terms of the Mozilla Public License 2.0 at https://mozilla.org/MPL/2.0/
//@version=4
// ██████╗██████╗ ███████╗ █████╗ ████████╗███████╗██████╗ ██████╗ ██╗ ██╗
//██╔════╝██╔══██╗██╔════╝██╔══██╗╚══██╔══╝██╔════╝██╔══██╗ ██╔══██╗╚██╗ ██╔╝
//██║ ██████╔╝█████╗ ███████║ ██║ █████╗ ██║ ██║ ██████╔╝ ╚████╔╝
//██║ ██╔══██╗██╔══╝ ██╔══██║ ██║ ██╔══╝ ██║ ██║ ██╔══██╗ ╚██╔╝
//╚██████╗██║ ██║███████╗██║ ██║ ██║ ███████╗██████╔╝ ██████╔╝ ██║
// ╚═════╝╚═╝ ╚═╝╚══════╝╚═╝ ╚═╝ ╚═╝ ╚══════╝╚═════╝ ╚═════╝ ╚═╝
//███████╗ ██████╗ ██╗ ██╗ ██╗████████╗██╗ ██████╗ ███╗ ██╗███████╗ ██╗ █████╗ ███████╗ █████╗
//██╔════╝██╔═══██╗██║ ██║ ██║╚══██╔══╝██║██╔═══██╗████╗ ██║██╔════╝███║██╔══██╗╚════██║██╔══██╗
//███████╗██║ ██║██║ ██║ ██║ ██║ ██║██║ ██║██╔██╗ ██║███████╗╚██║╚██████║ ██╔╝╚█████╔╝
//╚════██║██║ ██║██║ ██║ ██║ ██║ ██║██║ ██║██║╚██╗██║╚════██║ ██║ ╚═══██║ ██╔╝ ██╔══██╗
//███████║╚██████╔╝███████╗╚██████╔╝ ██║ ██║╚██████╔╝██║ ╚████║███████║ ██║ █████╔╝ ██║ ╚█████╔╝
//╚══════╝ ╚═════╝ ╚══════╝ ╚═════╝ ╚═╝ ╚═╝ ╚═════╝ ╚═╝ ╚═══╝╚══════╝ ╚═╝ ╚════╝ ╚═╝ ╚════╝
strategy(shorttitle='Ain1 No Label',title='All in One Strategy no RSI Label', overlay=true, scale=scale.left, initial_capital = 1000, process_orders_on_close=true, default_qty_type = strategy.percent_of_equity, default_qty_value = 100, commission_type=strategy.commission.percent, commission_value=0.18, calc_on_every_tick=true)
kcolor = color.new(#0094FF, 60)
dcolor = color.new(#FF6A00, 60)
// ----------------- Strategy Inputs -------------------------------------------------------------
//Backtest dates with auto finish date of today
start = input(defval = timestamp("01 April 2021 00:00 -0500"), title = "Start Time", type = input.time)
finish = input(defval = timestamp("31 December 2021 00:00 -0600"), title = "End Time", type = input.time)
window() => true // create function "within window of time"
// Strategy Selection - Long, Short, or Both
stratinfo = input(true, "Long/Short for Mixed Market, Long for Bull, Short for Bear")
strat = input(title="Trade Types", defval="Long/Short", options=["Long Only", "Long/Short", "Short Only"])
strat_val = strat == "Long Only" ? 1 : strat == "Long/Short" ? 0 : -1
// Risk Management Inputs
sl= input(10.0, "Stop Loss %", minval = 0, maxval = 100, step = 0.01)
stoploss = sl/100
tp = input(20.0, "Target Profit %", minval = 0, maxval = 100, step = 0.01)
TargetProfit = tp/100
useXRSI = input(false, "Use RSI crossing back, select only one strategy")
useCRSI = input(false, "Use Tweaked Connors RSI, select only one")
RSIInfo = input(true, "These are the RSI Strategy Inputs, RSI Length applies to MACD, set OB and OS to 45 for using Stoch and EMA strategies.")
length = input(14, "RSI Length", minval=1)
overbought= input(62, "Overbought")
oversold= input(35, "Oversold")
cl1 = input(3, "Connor's MA Length 1", minval=1, step=1)
cl2 = input(20, "Connor's MA Lenght 2", minval=1, step=1)
cl3 = input(50, "Connor's MA Lenght 3", minval=1, step=1)
// MACD and EMA Inputs
useMACD = input(false, "Use MACD Only, select only one strategy")
useEMA = input(false, "Use EMA Only, select only one strategy (EMA uses Stochastic inputs too)")
MACDInfo=input(true, "These are the MACD strategy variables")
fastLength = input(5, minval=1, title="EMA Fast Length")
slowLength = input(10, minval=1, title="EMA Slow Length")
ob_min = input(52, "Overbought Lookback Minimum Value", minval=0, maxval=200)
ob_lb = input(25, "Overbought Lookback Bars", minval=0, maxval=100)
os_min = input(50, "Oversold Lookback Minimum Value", minval=0, maxval=200)
os_lb = input(35, "Oversold Lookback Bars", minval=0, maxval=100)
source = input(title="Source", type=input.source, defval=close)
RSI = rsi(source, length)
// Price Movement Inputs
PriceInfo = input(true, "Price Change Percentage Cross Check Inputs for all Strategies, added logic to avoid early sell")
lkbk = input(5,"Max Lookback Period")
// EMA and SMA Background Inputs
useStoch = input(false, "Use Stochastic Strategy, choose only one")
StochInfo = input(true, "Stochastic Strategy Inputs")
smoothK = input(3, "K", minval=1)
smoothD = input(3, "D", minval=1)
k_mode = input("SMA", "K Mode", options=["SMA", "EMA", "WMA"])
high_source = input(high,"High Source")
low_source= input(low,"Low Source")
HTF = input("","Curernt or Higher time frame only", type=input.resolution)
// Selections to show or hide the overlays
showZones = input(true, title="Show Bullish/Bearish Zones")
showStoch = input(true, title="Show Stochastic Overlays")
showRSIBS = input(true, title="Show RSI Buy Sell Zones")
showMACD = input(true, title="Show MACD")
color_bars=input(true, "Color Bars")
// ------------------ Dynamic RSI Calculation ----------------------------------------
AvgHigh(src,cnt,val) =>
total = 0.0
count = 0
for i = 0 to cnt
if src[i] > val
count := count + 1
total := total + src[i]
round(total / count)
RSI_high = AvgHigh(RSI, ob_lb, ob_min)
AvgLow(src,cnt,val) =>
total = 0.0
count = 0
for i = 0 to cnt
if src[i] < val
count := count + 1
total := total + src[i]
round(total / count)
RSI_low = AvgLow(RSI, os_lb, os_min)
// ------------------ Price Percentage Change Calculation -----------------------------------------
perc_change(lkbk) =>
overall_change = ((close[0] - open[lkbk]) / open[lkbk]) * 100
highest_high = 0.0
lowest_low = 0.0
for i = lkbk to 0
highest_high := i == lkbk ? high : high[i] > high[(i + 1)] ? high[i] : highest_high[1]
lowest_low := i == lkbk ? low : low[i] < low[(i + 1)] ? low[i] : lowest_low[1]
start_to_high = ((highest_high - open[lkbk]) / open[lkbk]) * 100
start_to_low = ((lowest_low - open[lkbk]) / open[lkbk]) * 100
previous_to_high = ((highest_high - open[1])/open[1])*100
previous_to_low = ((lowest_low-open[1])/open[1])*100
previous_bar = ((close[1]-open[1])/open[1])*100
[overall_change, start_to_high, start_to_low, previous_to_high, previous_to_low, previous_bar]
// Call the function
[overall, to_high, to_low, last_high, last_low, last_bar] = perc_change(lkbk)
// Plot the function
//plot(overall*50, color=color.white, title='Overall Percentage Change', linewidth=3)
//plot(to_high*50, color=color.green,title='Percentage Change from Start to High', linewidth=2)
//plot(to_low*50, color=color.red, title='Percentage Change from Start to Low', linewidth=2)
//plot(last_high*100, color=color.teal, title="Previous to High", linewidth=2)
//plot(last_low*100, color=color.maroon, title="Previous to Close", linewidth=2)
//plot(last_bar*100, color=color.orange, title="Previous Bar", linewidth=2)
//hline(0, title='Center Line', color=color.orange, linewidth=2)
true_dip = overall < 0 and to_high > 0 and to_low < 0 and last_high > 0 and last_low < 0 and last_bar < 0
true_peak = overall > 0 and to_high > 0 and to_low > 0 and last_high > 0 and last_low < 0 and last_bar > 0
alertcondition(true_dip, title='True Dip', message='Dip')
alertcondition(true_peak, title='True Peak', message='Peak')
// ------------------ Background Colors based on EMA Indicators -----------------------------------
// Uses standard lengths of 9 and 21, if you want control delete the constant definition and uncomment the inputs
haClose(gap) => (open[gap] + high[gap] + low[gap] + close[gap]) / 4
rsi_ema = rsi(haClose(0), length)
v2 = ema(rsi_ema, length)
v3 = 2 * v2 - ema(v2, length)
emaA = ema(rsi_ema, fastLength)
emaFast = 2 * emaA - ema(emaA, fastLength)
emaB = ema(rsi_ema, slowLength)
emaSlow = 2 * emaB - ema(emaB, slowLength)
//plot(rsi_ema, color=color.white, title='RSI EMA', linewidth=3)
//plot(v2, color=color.green,title='v2', linewidth=2)
//plot(v3, color=color.red, title='v3', linewidth=2)
//plot(emaFast, color=color.teal, title="EMA Fast", linewidth=2)
//plot(emaSlow, color=color.maroon, title="EMA Slow", linewidth=2)
EMABuy = crossunder(emaFast, v2) and window()
EMASell = crossover(emaFast, emaSlow) and window()
alertcondition(EMABuy, title='EMA Buy', message='EMA Buy Condition')
alertcondition(EMASell, title='EMA Sell', message='EMA Sell Condition')
// bullish signal rule:
bullishRule =emaFast > emaSlow
// bearish signal rule:
bearishRule =emaFast < emaSlow
// current trading State
ruleState = 0
ruleState := bullishRule ? 1 : bearishRule ? -1 : nz(ruleState[1])
ruleColor = ruleState==1 ? color.new(color.blue, 90) : ruleState == -1 ? color.new(color.red, 90) : ruleState == 0 ? color.new(color.gray, 90) : na
bgcolor(showZones ? ruleColor : na, title="Bullish/Bearish Zones")
// ------------------ Stochastic Indicator Overlay -----------------------------------------------
// Calculation
// Use highest highs and lowest lows
h_high = highest(high_source ,lkbk)
l_low = lowest(low_source ,lkbk)
stoch = stoch(RSI, RSI_high, RSI_low, length)
k =
k_mode=="EMA" ? ema(stoch, smoothK) :
k_mode=="WMA" ? wma(stoch, smoothK) :
sma(stoch, smoothK)
d = sma(k, smoothD)
k_c = change(k)
d_c = change(d)
kd = k - d
// Plot
signalColor = k>oversold and d<overbought and k>d and k_c>0 and d_c>0 ? kcolor :
k<overbought and d>oversold and k<d and k_c<0 and d_c<0 ? dcolor : na
kp = plot(showStoch ? k : na, "K", color=kcolor)
dp = plot(showStoch ? d : na, "D", color=dcolor)
fill(kp, dp, color = signalColor, title="K-D")
signalUp = showStoch ? not na(signalColor) and kd>0 : na
signalDown = showStoch ? not na(signalColor) and kd<0 : na
//plot(signalUp ? kd : na, "Signal Up", color=kcolor, transp=90, style=plot.style_columns)
//plot(signalDown ? (kd+100) : na , "Signal Down", color=dcolor, transp=90, style=plot.style_columns, histbase=100)
//StochBuy = crossover(k, d) and kd>0 and to_low<0 and window()
//StochSell = crossunder(k,d) and kd<0 and to_high>0 and window()
StochBuy = crossover(k, d) and window()
StochSell = crossunder(k, d) and window()
alertcondition(StochBuy, title='Stoch Buy', message='K Crossing D')
alertcondition(StochSell, title='Stoch Sell', message='D Crossing K')
// -------------- Add Price Movement -------------------------
// Calculations
h1 = vwma(high, length)
l1 = vwma(low, length)
hp = h_high[1]
lp = l_low[1]
// Plot
var plot_color=#353535
var sig = 0
if (h1 >hp)
sig:=1
plot_color:=color.lime
else if (l1 <lp)
sig:=-1
plot_color:=color.maroon
//plot(1,title = "Price Movement Bars", style=plot.style_columns,color=plot_color)
//plot(sig,title="Signal 1 or -1",display=display.none)
// --------------------------------------- RSI Plot ----------------------------------------------
// Plot Oversold and Overbought Lines
over = hline(oversold, title="Oversold", color=color.green)
under = hline(overbought, title="Overbought", color=color.red)
fillcolor = color.new(#9915FF, 90)
fill(over, under, fillcolor, title="Band Background")
// Show RSI and EMA crosses with arrows and RSI Color (tweaked Connors RSI)
// Improves strategy setting ease by showing where EMA 5 crosses EMA 10 from above to confirm overbought conditions or trend reversals
// This shows where you should enter shorts or exit longs
// Tweaked Connors RSI Calculation
connor_ob = overbought
connor_os = oversold
ma1 = sma(close,cl1)
ma2 = sma(close, cl2)
ma3 = sma(close, cl3)
// Buy Sell Zones using tweaked Connors RSI (RSI values of 80 and 20 for Crypto as well as ma3, ma20, and ma50 are the tweaks)
RSI_SELL = ma1 > ma2 and open > ma3 and RSI >= connor_ob and true_peak and window()
RSI_BUY = ma2 < ma3 and ma3 > close and RSI <= connor_os and true_dip and window()
alertcondition(RSI_BUY, title='Connors Buy', message='Connors RSI Buy')
alertcondition(RSI_SELL, title='Connors Sell', message='Connors RSI Sell')
// Color Definition
col = useCRSI ? (close > ma2 and close < ma3 and RSI <= connor_os ? color.lime : close < ma2 and close > ma3 and RSI <= connor_ob ? color.red : color.yellow ) : color.yellow
// Plot colored RSI Line
plot(RSI, title="RSI", linewidth=3, color=col)
//------------------- MACD Strategy -------------------------------------------------
[macdLine, signalLine, _] = macd(close, fastLength, slowLength, length)
bartrendcolor = macdLine > signalLine and k > 50 and RSI > 50 ? color.teal : macdLine < signalLine and k < 50 and RSI < 50 ? color.maroon : macdLine < signalLine ? color.yellow : color.gray
barcolor(color = color_bars ? bartrendcolor : na)
MACDBuy = macdLine>signalLine and RSI<RSI_low and overall<0 and window()
MACDSell = macdLine<signalLine and RSI>RSI_high and overall>0 and window()
//plotshape(showMACD ? MACDBuy: na, title = "MACD Buy", style = shape.arrowup, text = "MACD Buy", color=color.green, textcolor=color.green, size=size.small)
//plotshape(showMACD ? MACDSell: na, title = "MACD Sell", style = shape.arrowdown, text = "MACD Sell", color=color.red, textcolor=color.red, size=size.small)
MACColor = MACDBuy ? color.new(color.teal, 50) : MACDSell ? color.new(color.maroon, 50) : na
bgcolor(showMACD ? MACColor : na, title ="MACD Signals")
// -------------------------------- Entry and Exit Logic ------------------------------------
// Entry Logic
XRSI_OB = crossunder(RSI, overbought) and overall<0 and window()
RSI_OB = RSI>overbought and true_peak and window()
XRSI_OS = crossover(RSI, oversold) and overall>0 and window()
RSI_OS = RSI<oversold and true_dip and window()
alertcondition(XRSI_OB, title='Reverse RSI Sell', message='RSI Crossing back under OB')
alertcondition(XRSI_OS, title='Reverse RSI Buy', message='RSI Crossing back over OS')
alertcondition(RSI_OS, title='RSI Buy', message='RSI Crossover OS')
alertcondition(RSI_SELL, title='RSI Sell', message='RSI Crossunder OB')
// Strategy Entry and Exit with built in Risk Management
GoLong = strategy.position_size==0 and strat_val > -1 and rsi_ema > RSI and k < d ? (useXRSI ? XRSI_OS : useMACD ? MACDBuy : useCRSI ? RSI_BUY : useStoch ? StochBuy : RSI_OS) : false
GoShort = strategy.position_size==0 and strat_val < 1 and rsi_ema < RSI and d < k ? (useXRSI ? XRSI_OB : useMACD ? MACDSell : useCRSI ? RSI_SELL : useStoch ? StochSell : RSI_OB) : false
if (GoLong)
strategy.entry("LONG", strategy.long)
if (GoShort)
strategy.entry("SHORT", strategy.short)
longStopPrice = strategy.position_avg_price * (1 - stoploss)
longTakePrice = strategy.position_avg_price * (1 + TargetProfit)
shortStopPrice = strategy.position_avg_price * (1 + stoploss)
shortTakePrice = strategy.position_avg_price * (1 - TargetProfit)
//plot(series=(strategy.position_size > 0) ? longTakePrice : na, color=color.green, style=plot.style_circles, linewidth=3, title="Long Take Profit")
//plot(series=(strategy.position_size < 0) ? shortTakePrice : na, color=color.green, style=plot.style_circles, linewidth=3, title="Short Take Profit")
//plot(series=(strategy.position_size > 0) ? longStopPrice : na, color=color.red, style=plot.style_cross, linewidth=2, title="Long Stop Loss")
//plot(series=(strategy.position_size < 0) ? shortStopPrice : na, color=color.red, style=plot.style_cross, linewidth=2, title="Short Stop Loss")
if (strategy.position_size > 0)
strategy.exit(id="Exit Long", from_entry = "LONG", stop = longStopPrice, limit = longTakePrice)
if (strategy.position_size < 0)
strategy.exit(id="Exit Short", from_entry = "SHORT", stop = shortStopPrice, limit = shortTakePrice)
CloseLong = strat_val > -1 and strategy.position_size > 0 and rsi_ema > RSI and d > k ? (useXRSI ? XRSI_OB : useMACD ? MACDSell : useCRSI ? RSI_SELL : RSI_OB) : false
if(CloseLong)
strategy.close("LONG")
CloseShort = strat_val < 1 and strategy.position_size < 0 and rsi_ema < RSI and k > d ? (useXRSI ? XRSI_OS : useMACD ? MACDBuy : useCRSI ? RSI_BUY : RSI_OS) : false
if(CloseShort)
strategy.close("SHORT")