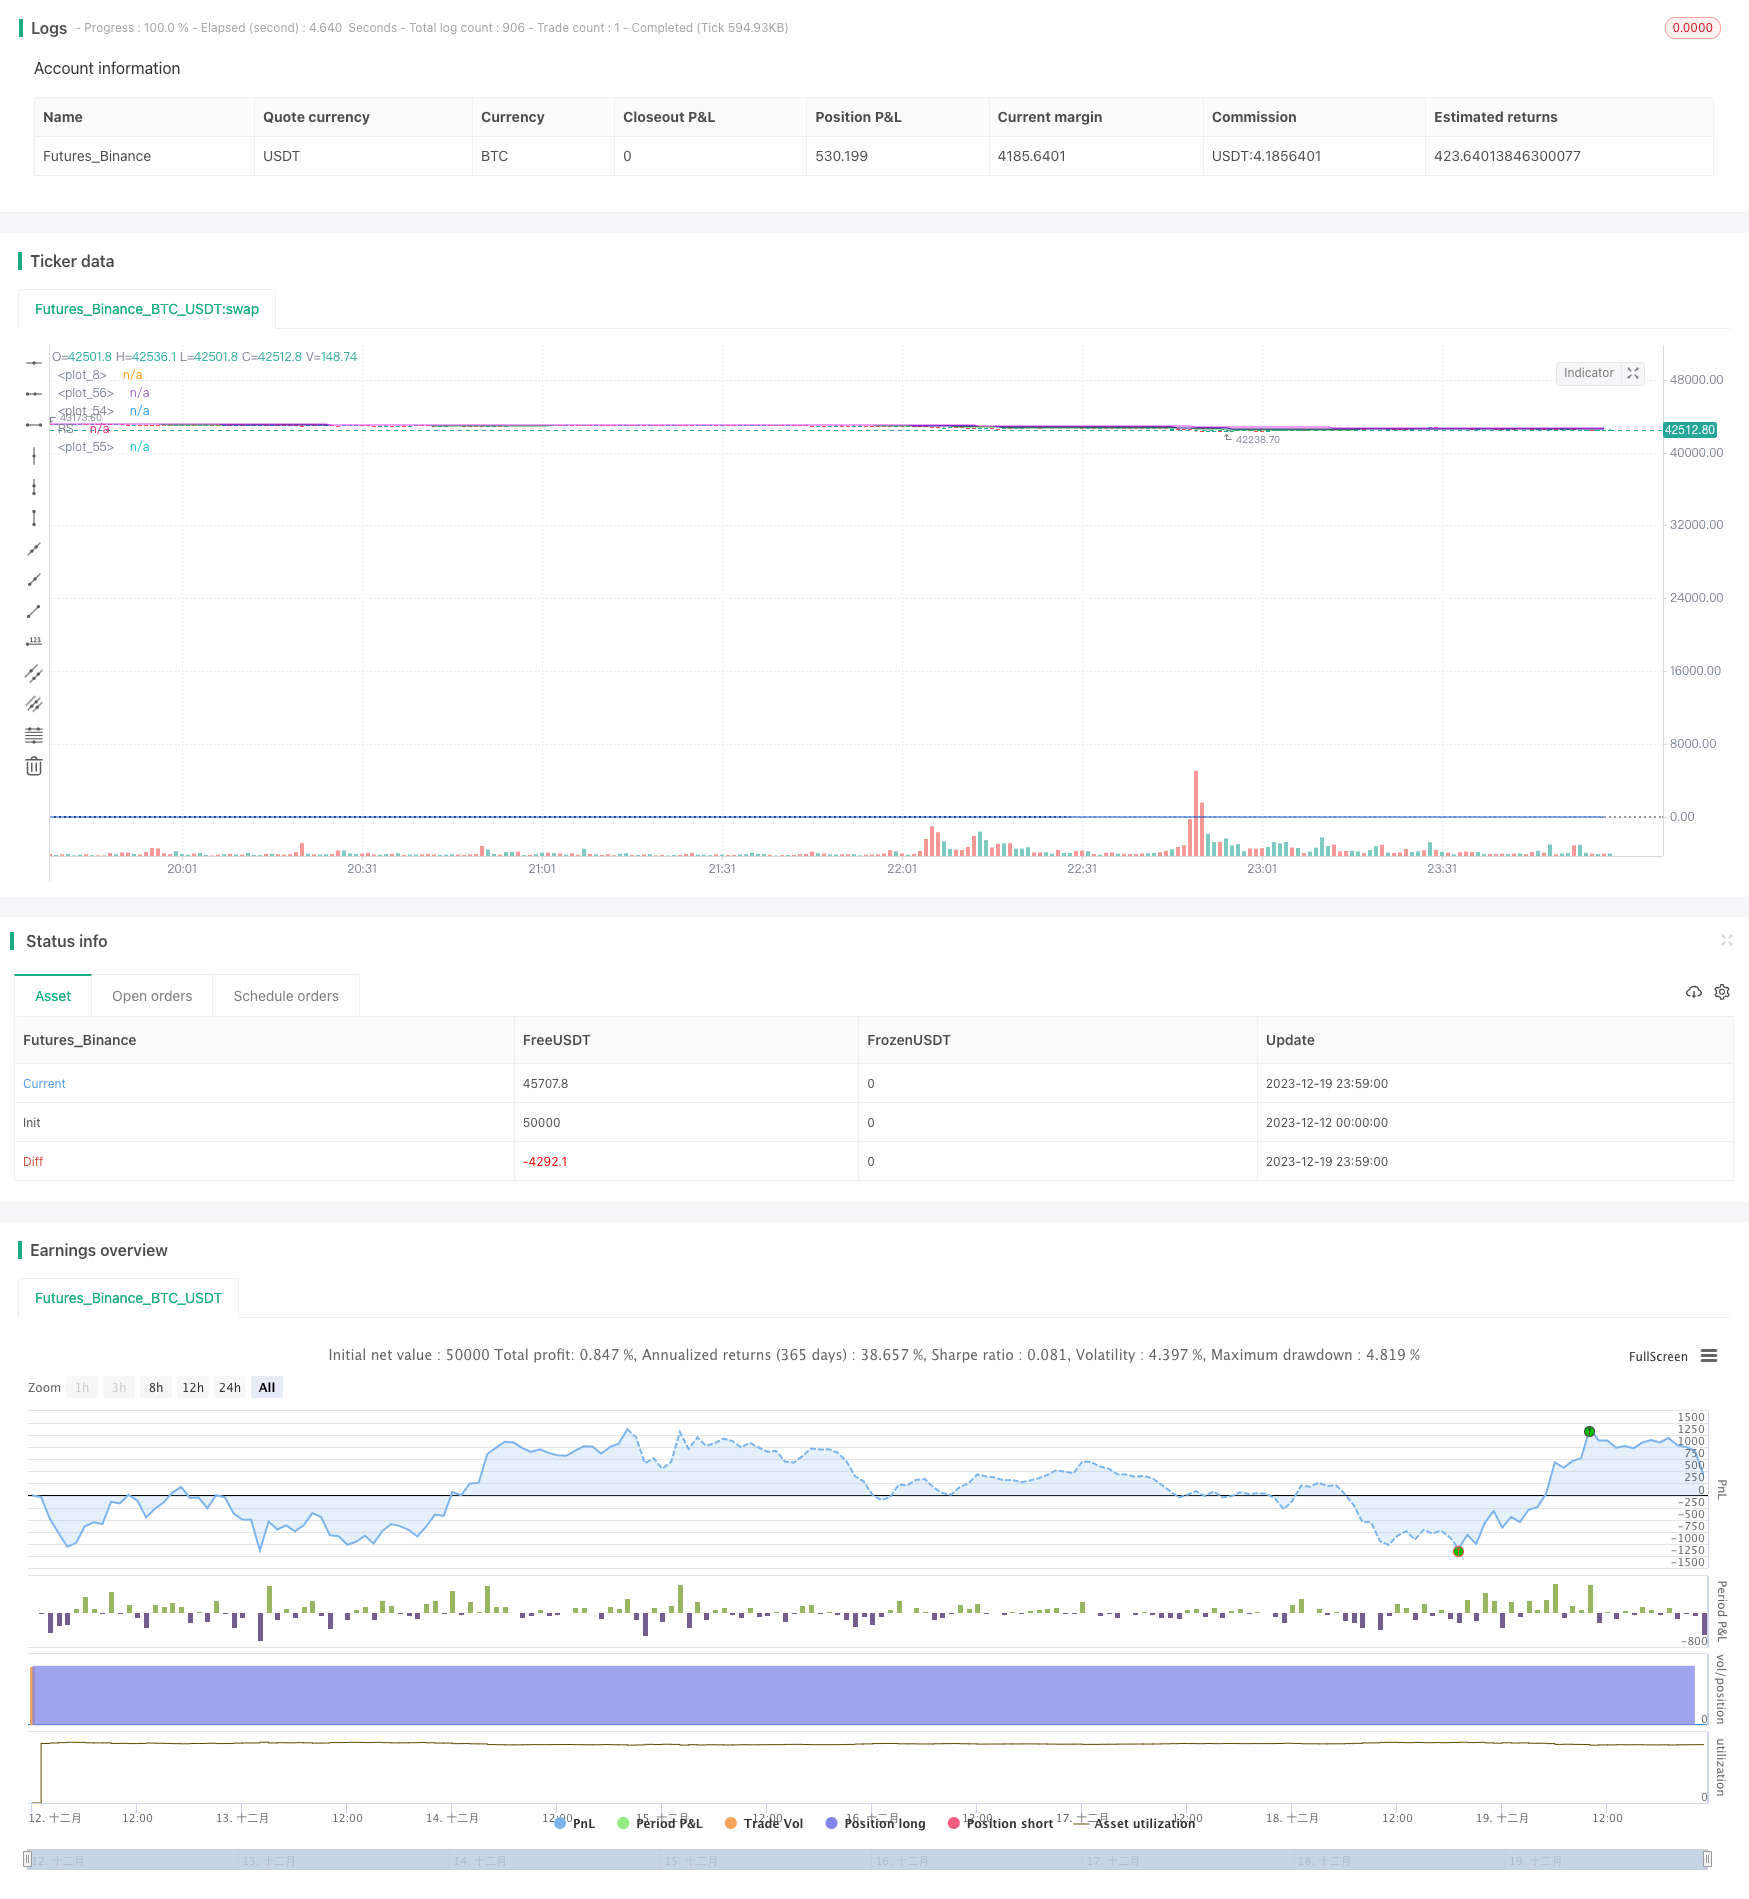
二重移動平均とボラティリティに基づく株式投資戦略
作成日:
2023-12-20 14:54:41
最終変更日:
2023-12-20 14:54:41
コピー:
0
クリック数:
680
1
フォロー
1628
フォロワー

概要
この戦略は,両均線と相対強度指標に基づいて,株式の歴史的変動率と組み合わせて,株式の自動買い売りを実現する.戦略の優点は,長線と短線を組み合わせて,リスクを効果的に制御できるという点である.しかし,一定の改善の余地もある.例えば,損失防止メカニズムを導入することを考慮できる.
戦略原則
戦略は,150周回線平均線と50日線急速平均線で構成される二重均線システム,および20日線最速平均線を使用する.価格が150周線を上越したときに,トレードスタートを上昇とみなし,価格が50日線を下越したときにトレードスタートを下降とみなす.このようにして,トレード上昇中に追いつき,下降を止め,下降中に随時損失を止めることができる.
さらに,戦略は,年間波動率の最高価格と相対強度指標を使用して,特定の買い時を決定します. 買い信号は,閉盘価格が年間波動率の計算による最高価格を超え,相対強度指標が正である場合にのみ発信されます.
戦略的優位性
- 二重均線システムを使用し,主要トレンドの変化を効果的に判断し,下落を追いつくことができます.
- 波動率指数と強度指数の追加により,揺れ動いている状況で波動的な流れを避ける
- 20日間の急上昇平均線が加えられれば,損失はより早く止まる.
戦略リスク
- 遅滞があるため,迅速に止まらない.
- ストップポイントが設定されず,大きな損失が起こりやすい
- パラメータ最適化不足,パラメータ設定が主観的
リスクを解決するために,ストップ・ローズを設定したり,ATR指標の倍数をストップ・幅として使用したりできる.さらに,より厳格な反測によってパラメータを最適化することもできる.
戦略最適化の方向性
- 損失防止の強化
- パラメータ最適化法で最適なパラメータを見つけます.
- 他の指標のフィルタリング信号,例えば,取引量指標などの追加を検討する
- 戦略を多要素モデルに変えて,より多くの指標を組み込むことも考えられます.
要約する
この戦略は,全体的に比較的に保守的な株式投資戦略である。主要トレンドを判断する双均線を使用し,波動率と強度指標の入場を組み合わせ,偽突破を効果的にフィルタリングすることができる。急速な均線の追加も,止損をさらに速くする。しかし,戦略は,止損機構の加入,パラメータ最適化の使用などの手段など,さらに最適化することができる。全体的に,この戦略は,長線保有株の投資家の使用に適している。
ストラテジーソースコード
/*backtest
start: 2023-12-12 00:00:00
end: 2023-12-20 00:00:00
period: 1m
basePeriod: 1m
exchanges: [{"eid":"Futures_Binance","currency":"BTC_USDT"}]
*/

//@version=4
//Relative Strength
strategy("Stan my man", overlay=true)
comparativeTickerId = input("BTC_USDT:swap",  title="Comparative Symbol")
l = input(50, type=input.integer, minval=1, title="Period")
baseSymbol = security(syminfo.tickerid, timeframe.period, close)
comparativeSymbol = security(comparativeTickerId, timeframe.period, close)
hline(0, color=color.black, linestyle=hline.style_dotted)
res = baseSymbol / baseSymbol[l] /(comparativeSymbol / comparativeSymbol[l]) - 1
plot(res, title="RS", color=#1155CC)

//volume ma
vol1 = sma(volume,20)
// 30 week ma
ema1 = ema(close, 150)
//consolidation
h1 = highest(high[1],365)

fastPeriod = input(title="Fast MA", type=input.integer, defval=50)
slowPeriod = input(title="Slow MA", type=input.integer, defval=150)
fastestperiod = input(title="Fastest MA", type=input.integer, defval=20)

fastEMA = ema(close, fastPeriod)
slowEMA = ema(close, slowPeriod)
fastestEMA = ema(close, fastestperiod)

monitorStrategy = close < close[20]


// trade conditions
buytradecondition1 = close >ema1 and res>0 and volume> 1.5*vol1 and close > h1
buytradecondition2 = close > fastEMA  and volume> 1.5* vol1
selltradecondition1  = close< 0.95 * fastEMA
selltradecondition2  = close< 0.90 * open

if (buytradecondition1)
    strategy.entry("long",strategy.long,alert_message ="Seems ready to Buy")
    alert("Buy Alert Price (" + tostring(close) + ") crossed over Slow moving average",alert.freq_all)

if (buytradecondition2)
    strategy.entry("long",strategy.long,alert_message ="Seems ready to Buy")
    alert("Buy Alert Price (" + tostring(close) + ") crossed over fast moving average",alert.freq_all)

if (selltradecondition1)
    strategy.close("long",alert_message ="Seems ready to Sell")
    alert("Sell Alert Price (" + tostring(close) + ") crossed down fast moving average",alert.freq_all)

if (selltradecondition2)
    strategy.close("long",alert_message ="Seems ready to Sell")
    alert("Sell Alert Price (" + tostring(close) + ") crossed down 10% below open price  ",alert.freq_all)

//alertcondition(buytradecondition1,title ="BuySignal", message ="Price Crossed Slow Moving EMA ")

plot(fastEMA, color=color.navy)
plot(slowEMA, color=color.fuchsia)
plot(fastestEMA, color=color.green)