The Octagon Cloud Tracing Strategy

Overview
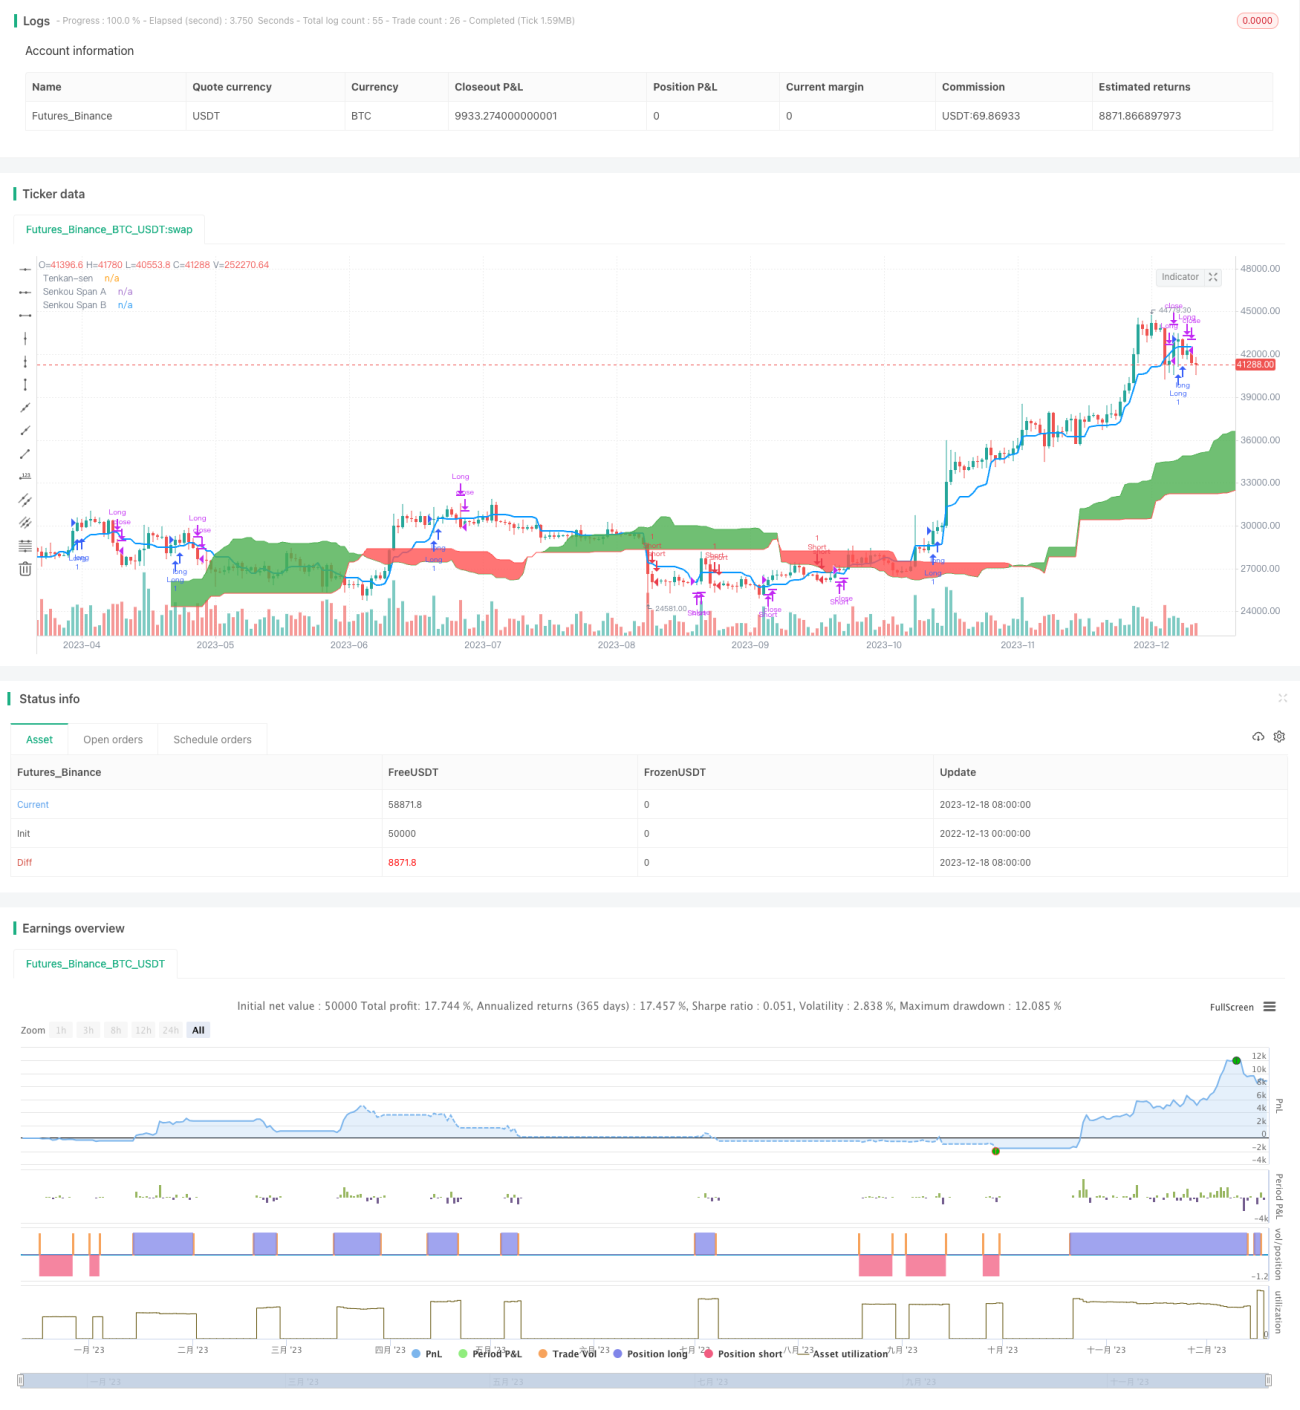
This is a quantitative trend-following strategy based on the Ichimoku indicator. It mainly constructs long and short positions under specific conditions to track market trends, combined with certain stop loss mechanisms to control risks.
Strategy Principle
The core of this strategy is to build trading signals based on the Ichimoku indicator with certain parameter settings. The Ichimoku indicator consists of four lines: the conversion line, the base line, the leading span A and the lagging span B. The conversion line is commonly known as the Tenkan-sen and the base line is called the Kijun-sen. This strategy sets up different parameters for Tenkan-sen and Kijun-sen to generate golden cross and dead cross trading signals. In addition, it also incorporates cloud breakouts as an auxiliary condition to trigger entries.
Specifically, the strategy mainly follows these trading rules:
-
Go long when price breaks above the Tenkan-sen and leaves the cloud;
-
Close long positions when price falls below the Tenkan-sen;
-
Go short when price breaks below the Kijun-sen and enters the cloud;
-
Close short positions when price rises back above the Tenkan-sen.
Through such long and short trading principles, the strategy can effectively capture trending moves in the market. Meanwhile, incorporating cloud breakouts filters out false signals to some extent.
Advantage Analysis
Compared with other common moving average trading strategies, this strategy has the following advantages:
-
More accurate trend judgment based on Ichimoku. Ichimoku consists of multiple moving averages, making it more reliable for trend recognition and filtering out noise from single MAs.
-
Better filter effect with multiple lines. Additional filter from cloud breakouts avoids false signals.
-
Controllable risks. Setting stop loss line allows timely stop loss and risk control.
-
Smaller drawdowns. Less adverse trades compared to other trend following strategies reduces drawdown loss.
-
Flexible parameter tuning. Parameters can be adjusted to adapt to different market conditions.
Risks and Optimization
There are still some risks to note for this strategy:
-
Poor performance in range-bound markets. Whipsaws may occur leading to float losses.
-
Inadequate reversal recognition. Weak in identifying short-term trend reversals, may miss opportunities or encounter sudden reversals.
-
Reliance on empirical parameter tuning. Different parameters can significantly impact performance which requires abundant historical experience.
The following aspects can be optimized to address the above risks:
-
Add volatility indicators to detect non-trending markets and pause strategy.
-
Incorporate additional reversal signals like moving average crossovers.
-
Utilize machine learning for automated parameter optimization instead of manual tuning.
-
Set up dynamic stop loss lines based on market volatility.
Conclusion
In general, this strategy leverages the strength of Ichimoku in catching trending moves. With proper parameter tuning and optimizations, it can achieve better robustness and serve as an efficient strategy worth considering for live trading.
- 1