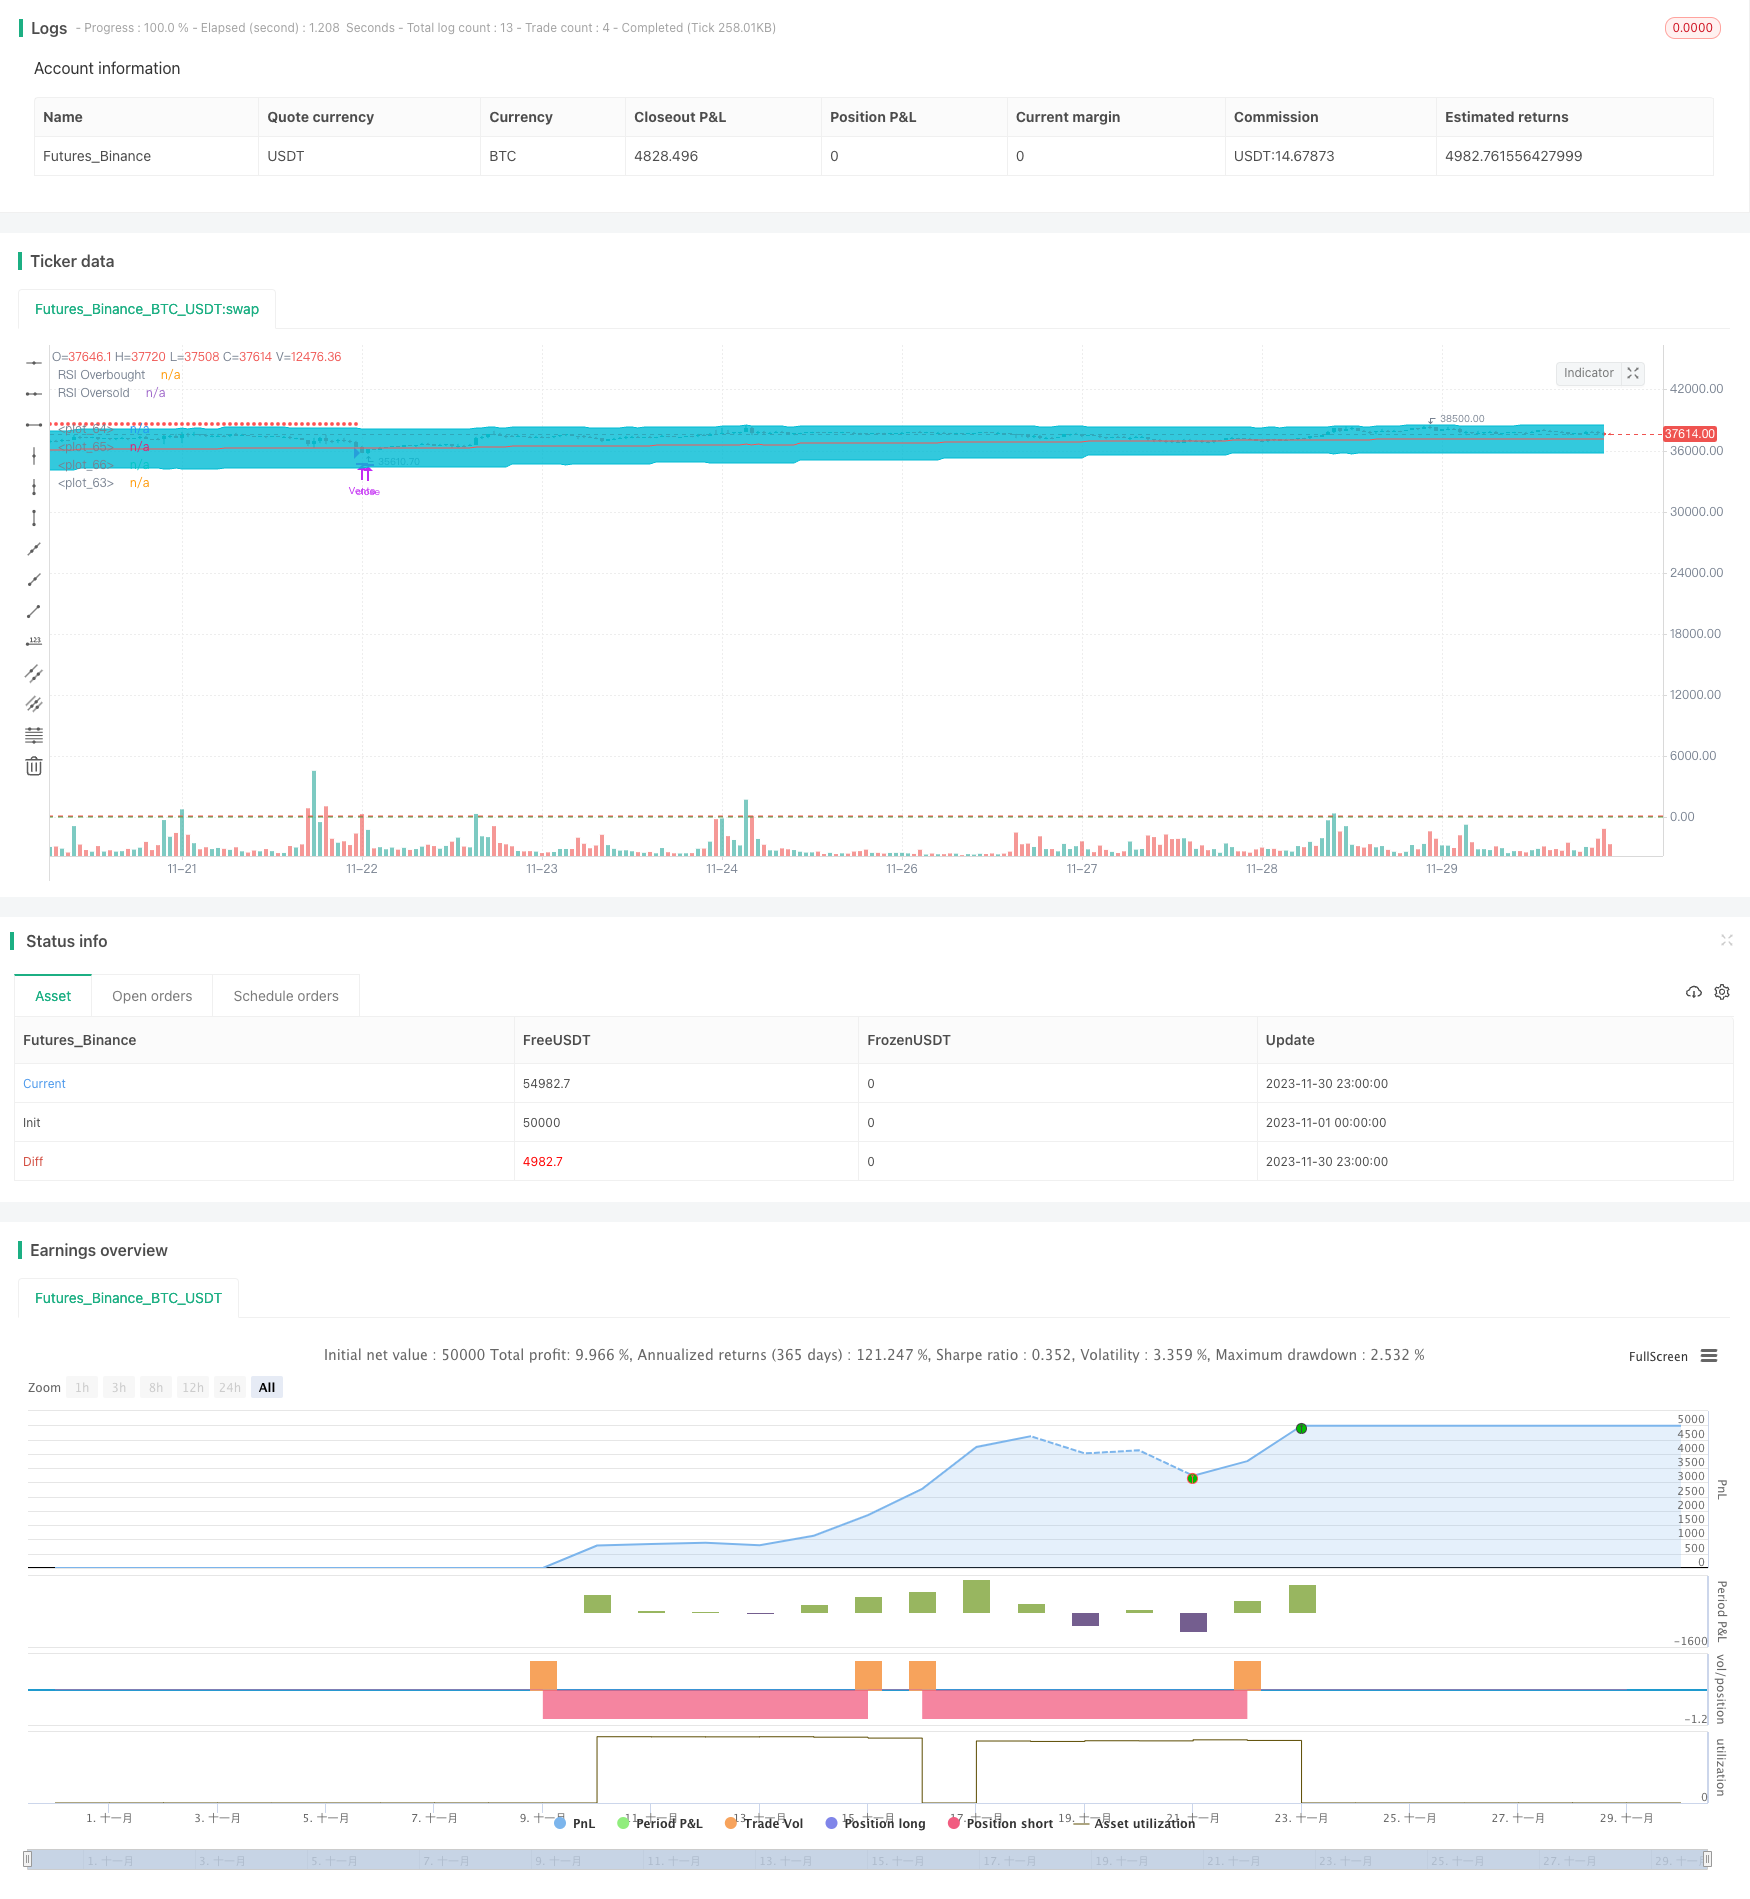
概述
本策略基于布林带和相对强弱指标(RSI)设计了一个量化交易策略。该策略结合了趋势跟踪和超买超卖的判断,旨在在趋势开始阶段进入市场,并在超买超卖情况下退出,以达到获利。
策略原理
该策略使用布林带来判断价格趋势和支撑阻力位。当价格接近布林带下轨时看作超卖信号;当价格接近布林带上轨时看作超买信号。同时,结合RSI指标判断是否超卖或超买。
具体交易规则是:当价格低于布林带下轨且RSI低于30时做多入场;当价格高于布林带上轨且RSI高于70时做空入场。止盈 Exit时,选择布林带中线或相反方向的布林带轨作为止盈位。止损设定为入场价的一定百分比。
策略优势
该策略结合布林带的趋势跟踪和RSI的超买超卖判断,能较好地把握趋势的启动点位。同时,止盈和止损策略也比较清晰,有利于风险管理。
相比单一使用布林带或RSI等指标,该策略综合运用多种指标和参数,可以提高决策的准确性。在参数调整合适的情况下,其交易表现会比较稳定。
策略风险
该策略主要依赖参数优化,如果参数设定不当,将面临较大的风险。例如布林带周期参数不匹配,就可能错过趋势或产生假信号。此外,止盈止损点位也需要仔细评估。
该策略对交易品种也有一定依赖性。对于波动较大的品种,需要调整布林带参数。对于趋势不明显的品种,效果也会打折扣。此外,策略也受到交易成本、滑点以及极端行情的影响。
建议进行参数优化测试,评估止盈止损水平,并测试不同品种和市场环境下的表现。同时预留资金Space进行风险管理。
优化方向
可以从以下几个方向继续优化该策略:
评估并优化布林带和RSI的参数,使之更加匹配所交易品种的特点
增加其他指标判断,如KDJ、MACD等,形成多因子模型
评估止盈止损策略,设置游动止损或分批止盈
根据特定品种和行情环境进行参数动态优化
增加机器学习模型判断信号质量和风险水平
总结
本策略整合布林带和RSI指标,设计了一套较完整的趋势跟踪策略。通过参数优化和风险管理,其效果和稳定性还有进一步改进空间。建议根据自身需要和风险偏好进行调整和优化,以期获得更好的绩效。
/*backtest
start: 2023-11-01 00:00:00
end: 2023-11-30 23:59:59
period: 1h
basePeriod: 15m
exchanges: [{"eid":"Futures_Binance","currency":"BTC_USDT"}]
*/

//@version=4
strategy("BB + RSI Estrategia", overlay=true)

longitud = input(20, title="Longitud BB", minval=5, maxval=50, step=1)
multiplicador = input(2.0, title="Multiplicador BB", type=input.float, step=0.1)
timeframe_bb = input("D", title="Marco de Tiempo BB", type=input.resolution)
rsi_length = input(14, title="Longitud RSI", minval=5, maxval=50, step=1)
rsi_overbought = input(70, title="Nivel de sobrecompra RSI", minval=50, maxval=80, step=1)
rsi_oversold = input(30, title="Nivel de sobreventa RSI", minval=20, maxval=50, step=1)
take_profit = input("Central", title="Take Profit (banda)", options=["Central", "Opuesta"])
stop_loss = input(2.00, title="Stop Loss", type=input.float, step=0.10)

var SL = 0.0

[banda_central, banda_superior, banda_inferior] = security(syminfo.tickerid, timeframe_bb, bb(close, longitud, multiplicador))
rsi_value = rsi(close, rsi_length)

comprado = strategy.position_size > 0
vendido = strategy.position_size < 0

if not comprado and not vendido
    if close < banda_inferior and rsi_value < rsi_oversold
        // Realizar la compra
        cantidad = round(strategy.equity / close)
        strategy.entry("Compra", strategy.long, qty=cantidad, when=cantidad > 0)
        SL := close * (1 - (stop_loss / 100))

    if close > banda_superior and rsi_value > rsi_overbought
        // Realizar la Venta
        cantidad = round(strategy.equity / close)
        strategy.entry("Venta", strategy.short, qty=cantidad, when=cantidad > 0)
        SL := close * (1 + (stop_loss / 100))

if comprado
    // Verificar el take profit
    if take_profit == "Central" and close >= banda_central
        strategy.close("Compra", comment="TP")
        SL := 0

    if take_profit == "Opuesta" and close >= banda_superior
        strategy.close("Compra", comment="TP")
        SL := 0
    // Verificar el stop loss
    if close <= SL
        strategy.close("Compra", comment="SL")
        SL := 0

if vendido
    // Verificar el take profit
    if take_profit == "Central" and close <= banda_central
        strategy.close("Venta", comment="TP")
        SL := 0

    if take_profit == "Opuesta" and close <= banda_inferior
        strategy.close("Venta", comment="TP")
        SL := 0
    // Verificar el Stop loss
    if close >= SL
        strategy.close("Venta", comment="SL")
        SL := 0

// Salida
plot(SL > 0 ? SL : na, style=plot.style_circles, color=color.red)
g1 = plot(banda_superior, color=color.aqua)
plot(banda_central, color=color.red)
g2 = plot(banda_inferior, color=color.aqua)
fill(g1, g2, color=color.aqua, transp=97)

// Dibujar niveles de sobrecompra/sobreventa del RSI
hline(rsi_overbought, "RSI Overbought", color=color.red)
hline(rsi_oversold, "RSI Oversold", color=color.green)