複数の指標に基づくトレンドフォロー戦略
概要
戦略の名前は多指標組合せ トレンド追跡戦略(Multi-Indicator Trend Tracking Strategy) は,フィッシャー変換指数,重量移動平均 ((WMA),相対的に強い指数 ((RSI) と均等線 ((OBV) など,複数の指標を使用して,市場のトレンド方向を判断し,トレンド追跡取引を実現する.
戦略原則
- フィッシャー変換指数は,価格の変化の傾向と強さを判断する. 4つのフィッシャー線が同時に色を変えたときに取引信号を発する.
- WMAは大きなトレンドの方向を判断する.RSIは偽信号をフィルターする.
- OBV指標はトレンドを確認するために使用されます.
具体的には,フィッシャー変換指標は,1倍,2倍,4倍および8倍4行で構成されている. 4行が同時に上向きに緑に転がると多信号が発生し,4行が同時に下向きに赤に転がると空信号が発生する.WMAは大きなトレンドの方向を判断し,指標が上向きであれば看板と判断し,下向きは看板と判断する.OBVはトレンドの方向を確認するために使用される.比較的強い指標であるRSIは偽信号をフィルターする.
優位分析
この戦略は以下の利点があります.
- フィッシャー変換指数は判断力が強いので,4つのフィッシャー線が同時に色を変えたとき,トレンドの逆転が起こる確率は高い.
- WMAは,主要トレンドの方向を判断し,逆転取引を避ける.
- OBV指標はトレンドを確認し,トレンドレス市場の偽突破を避ける.
- RSIは偽信号をフィルタリングし,信号の信頼性を確保する.
複数の指標の組み合わせにより,取引シグナルの正確性と信頼性を確保し,トレンドを追跡する能力を持つことで,優れた戦略効果が得られます.
リスク分析
この戦略にはいくつかのリスクがあります.
- 市場が収束した場合,フィッシャー線は偽信号を生じやすい.この場合,RSIフィルターに頼る必要がある.
- WMAパラメータの不適切な設定は,判断の accurancy にも影響する.
- ファイシャーの変換指数は超短線の判断に欠陥がある.
- ワイヤーを切断すると,巨額の損失を招く戦略だ.
リスクを軽減するために,RSIパラメータを適切に調整し,WMA周期パラメータを最適化できます.同時に,ストップ・ロスのポイントを設定し,過大な損失を避けることができます.
最適化の方向
この戦略は,以下の点でさらに改善できます.
- 異なる周期パラメータの下で戦略の効果をテストし,最適なパラメータ組み合わせを見つけることができます.
- 損失が一定比率に達したときに止まる.
- フィッシャー変換指標のパラメータを反測結果に基づいてさらに調整し,指標を判断する最も正確なパラメータの組み合わせを見つけます.
- フォーク・ウィーク・バイアスなどのフィルターを追加してみてください.
- 異なる開設ポジションのサイズ設定をテストする.
要約する
この戦略は,フィッシャー変換指数,WMA指数,OBV指数およびRSI指数を総合的に使用して市場のトレンド方向を判断する.判断信号は正確で,確認能力は強く,トレンドを効果的にロックして利益を得ることができる.パラメータを最適化することで,戦略のprofit factorをさらに向上させることができる.全体的に,この戦略は,指標の組み合わせによって判断され,高効率のトレンド追跡取引を実現し,良好な効果が得られる.
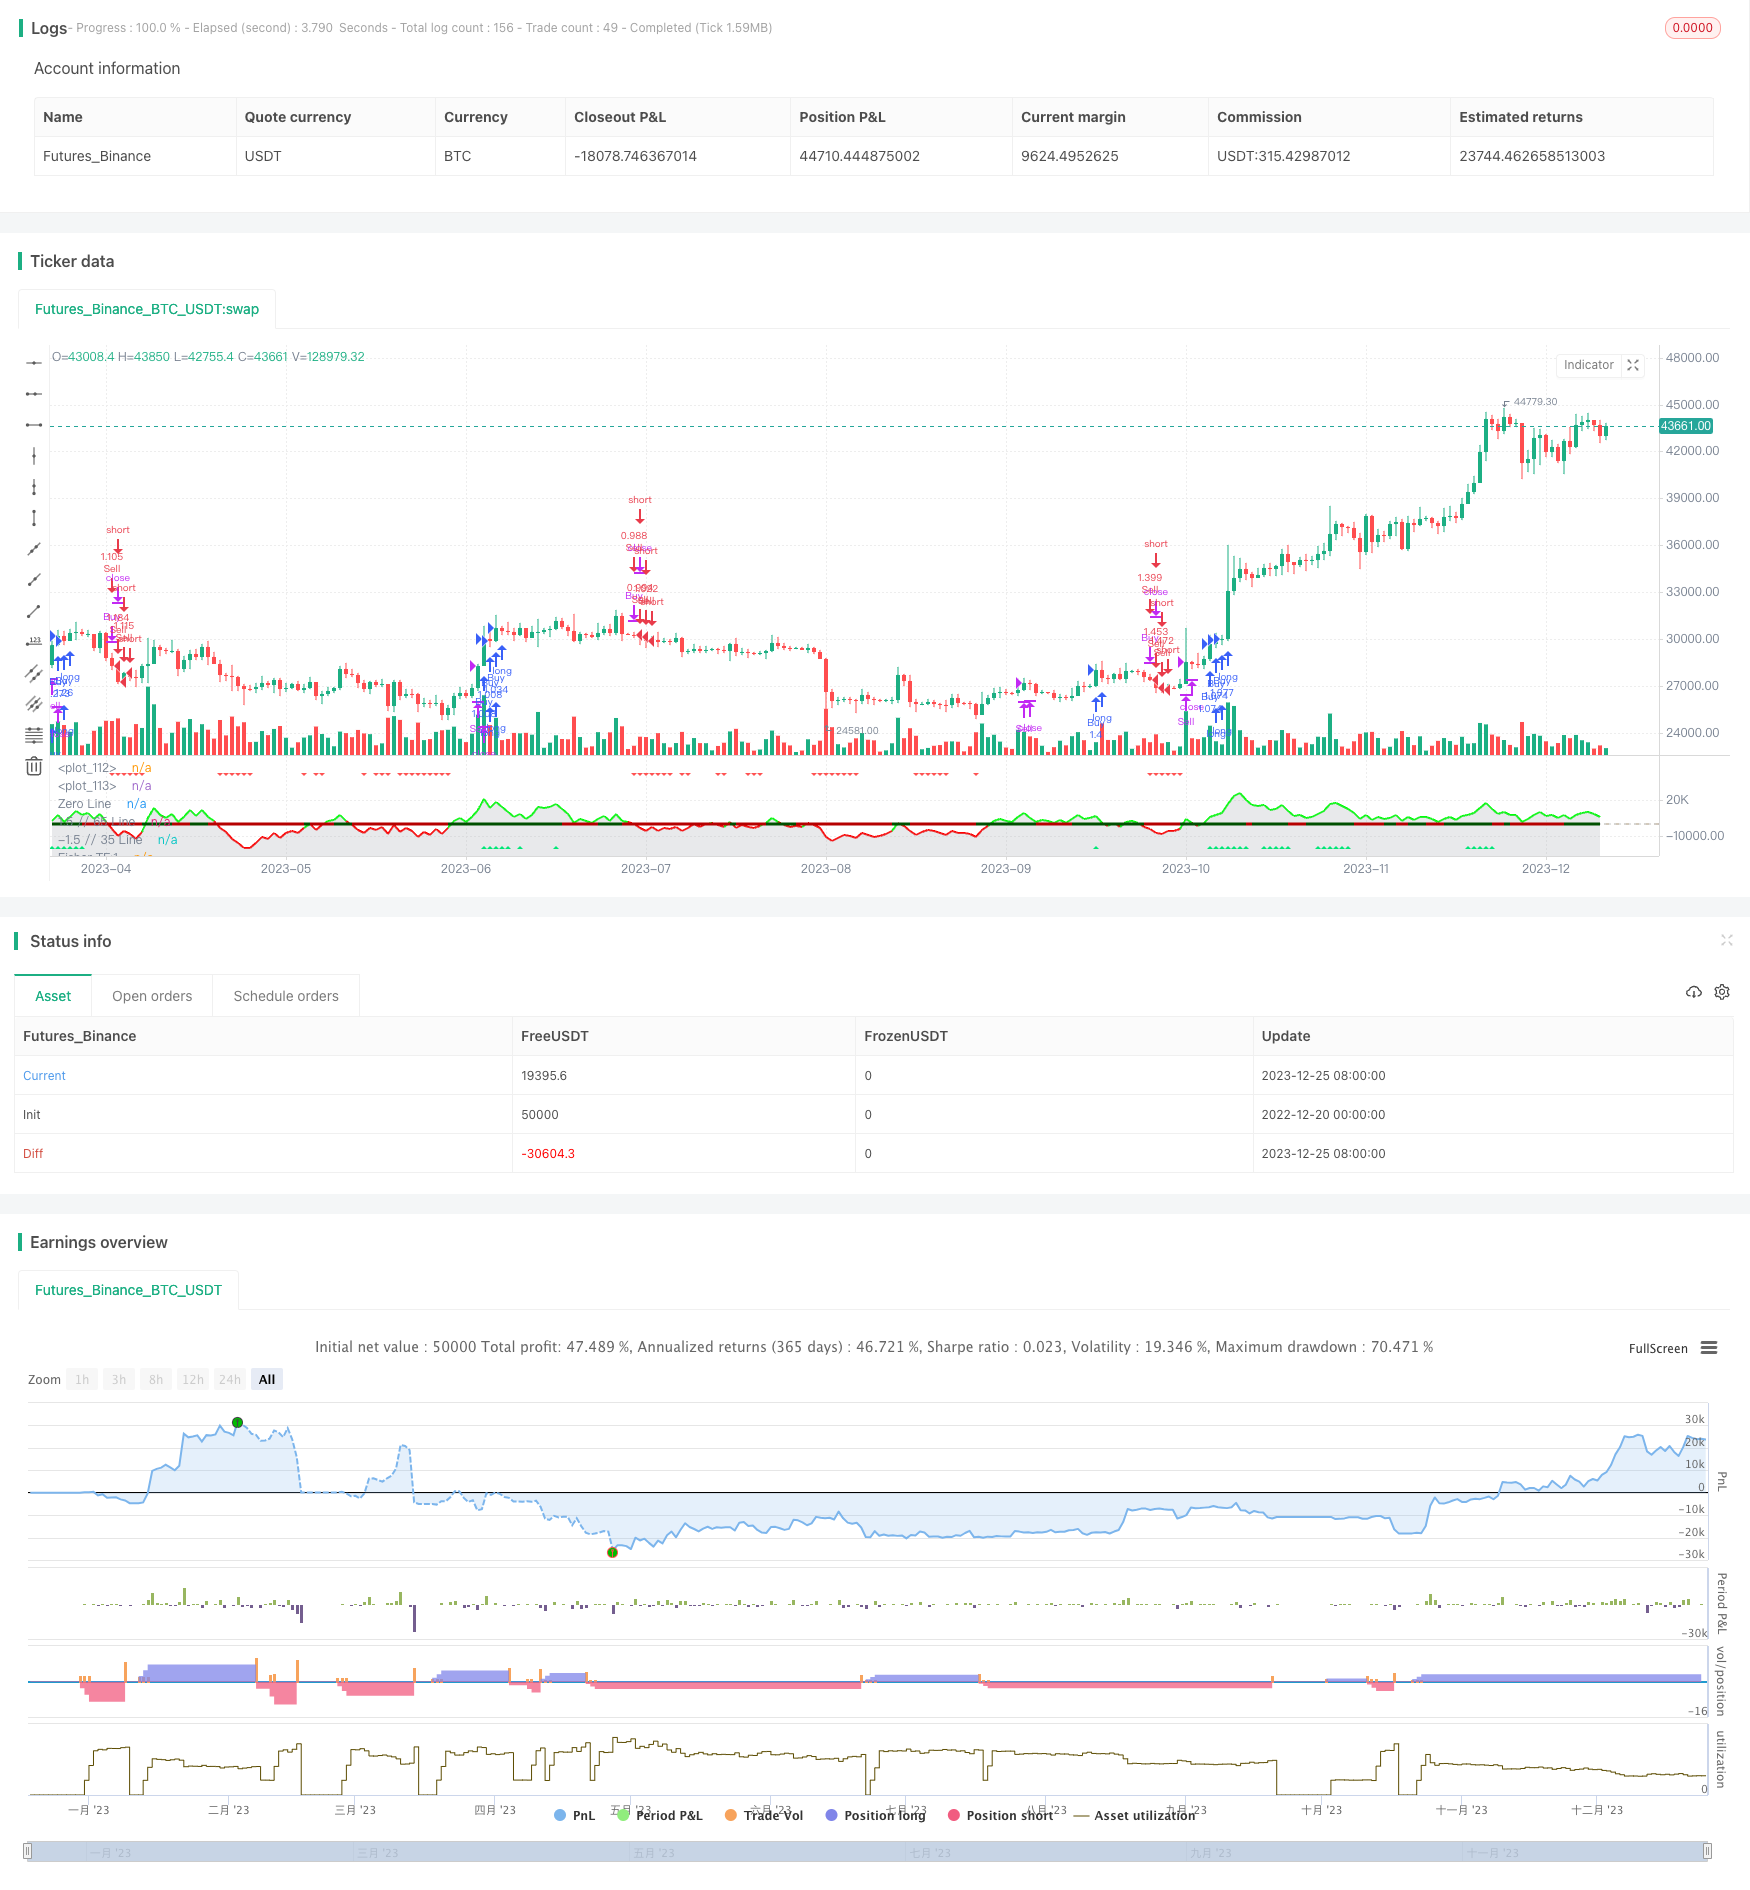
/*backtest
start: 2022-12-20 00:00:00
end: 2023-12-26 00:00:00
period: 1d
basePeriod: 1h
exchanges: [{"eid":"Futures_Binance","currency":"BTC_USDT"}]
*/

//@version=5
//author Sdover0123
strategy(title='FTR, WMA, OBV & RSI Strat', shorttitle='FTR WMA, OBV, RSI',overlay=false, default_qty_type=strategy.percent_of_equity, initial_capital = 100, default_qty_value=100, commission_value = 0.06, pyramiding = 3)
Len = input.int(10, minval=1, group ="Fisher Transform")
mult1 = input.int(1, minval=1, group ="Fisher Transform")
mult2 = input.int(2, minval=1, group ="Fisher Transform")
mult3 = input.int(4, minval=1, group ="Fisher Transform")
mult4 = input.int(8, minval=1, group ="Fisher Transform")
fish(Length, timeMultiplier) =>
    var nValue1 = 0.0
    var nValue2 = 0.0
    var nFish = 0.0
    xHL2 = hl2
    xMaxH = ta.highest(xHL2, Length * timeMultiplier)
    xMinL = ta.lowest(xHL2, Length * timeMultiplier)
    nValue1 := 0.33 * 2 * ((xHL2 - xMinL) / (xMaxH - xMinL) - 0.5) + 0.67 * nz(nValue1[1])
    if nValue1 > .99
        nValue2 := .999
        nValue2
    else if nValue1 < -.99
        nValue2 := -.999
        nValue2
    else
        nValue2 := nValue1
        nValue2
    nFish := 0.5 * math.log((1 + nValue2) / (1 - nValue2)) + 0.5 * nz(nFish[1])
    nFish
Fisher1 = fish(Len, mult1)
Fisher2 = fish(Len, mult2)
Fisher4 = fish(Len, mult3)
Fisher8 = fish(Len, mult4)

rsiLength = input.int(14, minval=1, group ="Moving Averages")
rsiVal = (ta.rsi(close, rsiLength) - 50) / 10
avg = strategy.position_avg_price

wma(source, length) =>
    sum = 0.0
    for i = 0 to length - 1
        sum := sum + source[i] * (length - i)
    wma = sum / (length * (length + 1) / 2)
    wma

wmaLength = input.int(10, "WMA Length", minval=1, group ="Moving Averages")
wmaClose = wma(close, wmaLength)
// Determine if WMA is bullish or bearish
isWmaBullish = wmaClose > wmaClose[1]
isWmaBearish = wmaClose < wmaClose[1]

//OBV
src = close
length = input.int(20, title="OBV Length", group="On-Balance Volume")
obv1(src) =>
    change_1 = ta.change(src)
    ta.cum(ta.change(src) > 0 ? volume : change_1 < 0 ? -volume : 0 * volume)*0.01
os = obv1(src)
obv_osc = os - ta.ema(os, length)
obc_color = (obv_osc > 0 ? color.rgb(0, 255, 8) : color.rgb(255, 0, 0))
plot(obv_osc, color=obc_color, style=plot.style_line, title='OBV-Points', linewidth=2)
plot(obv_osc, color=color.new(#b2b5be, 70), title='OBV', style=plot.style_area)
obvBullFilter = input.float(0.1, minval = 0, maxval = 5, step = 0.01, title ="OBV Bullish minimum value", group="On-Balance Volume")
obvBearFilter = input.float(-0.1, minval = -5, maxval = 0, step = 0.01, title ="OBV Bearish minimum value", group="On-Balance Volume")
obvBull = obv_osc > obvBullFilter
obvBear = obv_osc < obvBearFilter

// Add buy/sell signals
ReversalFilterDown = input.float(-0.7, 'Reversal Down TP Filter', -4, 4, step = 0.01, group = "RSI Level Filters", tooltip = "This is defined by taking the RSI value -50 and /10. When all Fisher lines are changing colour, this will SL/TP the long")
ReversalFilterUp = input.float(0.7, 'Reversal Up TP Filter', -4, 4, step = 0.01, group = "RSI Level Filters", tooltip = "This is defined by taking the RSI value -50 and /10. When all Fisher lines are changing colour, this will SL/TP the short")
RSILevelBuyFilter = input.float(1.66, 'RSI Level Buy Filter', -4, 4, step = 0.01, group = "RSI Level Filters", tooltip = "This is defined by taking the RSI value -50 and /10. Consider negative values")
RSILevelSellFilter = input.float(1, 'RSI Level Sell Filter', -4, 4, step = 0.01, group = "RSI Level Filters", tooltip = "This is defined by taking the RSI value -50 and /10. Consider negative values")
//buys - if breaking out and all Fisher are green and RSI filter value is met
buySignal = Fisher1 > Fisher1[1] and Fisher2 > Fisher2[1] and Fisher4 > Fisher4[1] and Fisher8 > Fisher8[1] and rsiVal > RSILevelBuyFilter and isWmaBullish and obvBull
ReversalUp = Fisher1 > Fisher1[1] and Fisher2 > Fisher2[1] and Fisher4 > Fisher4[1] and Fisher8 > Fisher8[1] and rsiVal > ReversalFilterUp
//sells - if breaking down and all Fisher are green and RSI filter value is met
sellSignal = Fisher1 < Fisher1[1] and Fisher2 < Fisher2[1] and Fisher4 < Fisher4[1] and Fisher8 < Fisher8[1] and rsiVal < RSILevelSellFilter and isWmaBearish and obvBear
ReversalDown = Fisher1 < Fisher1[1] and Fisher2 < Fisher2[1] and Fisher4 < Fisher4[1] and Fisher8 < Fisher8[1] and rsiVal < ReversalFilterDown


// Buy and Sell conditions
if buySignal and time>timestamp(2022, 06, 01, 09, 30) and barstate.isconfirmed
    strategy.close("Sell", comment = "Close Short")
    strategy.entry("Buy", strategy.long, comment = "Long")

if sellSignal and time>timestamp(2022, 06, 01, 09, 30) and barstate.isconfirmed
    strategy.close("Buy", comment = "Close Long")
    strategy.entry("Sell", strategy.short, comment = "Short")

if ReversalDown
    strategy.close("Buy", comment = "Close Long")

if ReversalUp
    strategy.close("Sell", comment = "Close Short")

//Plotting
//Fisher
plot(Fisher1, color=Fisher1 > nz(Fisher1[1]) ? color.green : color.rgb(255, 0, 0), title='Fisher TF:1')
plot(Fisher2, color=Fisher2 > nz(Fisher2[1]) ? color.green : color.rgb(255, 0, 0), title='Fisher TF:1', linewidth=2)
plot(Fisher4, color=Fisher4 > nz(Fisher4[1]) ? #008000 : #b60000, title='Fisher TF:1', linewidth=3)
plot(Fisher8, color=Fisher8 > nz(Fisher8[1]) ? #004f00 : #b60000, title='Fisher TF:1', linewidth=3)
//RSI
plot(rsiVal, color=rsiVal < 0 ? color.purple : color.yellow, linewidth=2, title='RSI')

//WMA
plot(isWmaBullish ? -2 : na, color=color.rgb(76, 175, 79, 20), linewidth=3, style=plot.style_linebr, title="WMA Bullish")
plot(isWmaBearish ? -2 : na, color=color.rgb(255, 82, 82, 20), linewidth=3, style=plot.style_linebr, title="WMA Bearish")

//Buy/Sell Signals
plotshape(buySignal, title='Buy Signal', location=location.bottom, color=color.new(color.lime, 0), style=shape.triangleup, size=size.small)
plotshape(sellSignal, title='Sell Signal', location=location.top, color=color.new(color.red, 0), style=shape.triangledown, size=size.small)

//Orientation
hline(RSILevelBuyFilter, color=color.rgb(25, 36, 99, 20), linestyle=hline.style_dotted, linewidth=2)
hline(RSILevelSellFilter, color=color.rgb(111, 27, 27, 20), linestyle=hline.style_dotted, linewidth=2)
hline(0, color=color.rgb(181, 166, 144, 39), linestyle=hline.style_dashed, linewidth=2, title = "Zero Line")
hline(1.5, color=color.rgb(217, 219, 220, 50), linestyle=hline.style_dotted, linewidth=2, title = "1.5 // 65 Line")
hline(-1.5, color=color.rgb(217, 219, 220, 50), linestyle=hline.style_dotted, linewidth=2, title = "-1.5 // 35 Line")