過去のボラティリティに基づく市場タイミング戦略
概要
この戦略は,歴史的な変動率に基づくフィルターを追加することで,改良版の買取と保有戦略を実現します.フィルターの役割は,市場の変動が大きい時期に買取ポジションを閉鎖し,変動が低い時に買取ポジションを再構築し,戦略の最大撤退を減らすことです.
戦略原則
- SPYの過去100日間の歴史変動率を計算する
- 現在の波動率が過去100日間の波動率の95点値より高い場合は,その取引日をフィルターして,買い買いポジションを閉じる
- 波動率が95点以下であれば,買いポジションを設定します.
優位分析
フィルターなしの単純な買入と保有戦略と比較して,この戦略は28年の追及期間に年収率が若干向上した (7.95% vs 9.92%),最大撤収が大幅に減少した (50.79% vs 31.57%).これは,市場波動性のフィルターを追加することで,戦略の収益率を一定程度向上させ,リスクを軽減できることを示している.
リスク分析
この戦略の主なリスクは,波動率の計算方法とフィルターパラメータの設定の正確さにある.波動率の計算が不正確であれば,フィルターは無効になります.フィルターパラメータの設定があまりにも保守的またはあまりにも過激であれば,戦略の収益に悪影響を及ぼします.さらに,Past performance is not indicative of future results,戦略の歴史的なパフォーマンスは将来のパフォーマンスを意味しません.
最適化の方向
長期移動平均線,大盤指数ADX指標など,他のフィルターインジケーターを確認信号として追加することを考えることができます.また,パラメータの調整最適化も重要です.例えば,異なる見返り期間,フィルタリングスレッジなどのパラメータ設定をテストします.機械学習と時間序列分析技術は,波動率予測モデルを構築し,最適化することもできます.
要約する
この戦略は,単純な歴史変動に基づくフィルターによって,SPY買入保有戦略の収益率を大幅に高め,最大撤退を大幅に削減しました. これは,市場状態の認識と資産配置の重要性を証明しています. 変動率のモデルを継続的に最適化し,確認信号を追加することで,この戦略をさらに完善することができます.
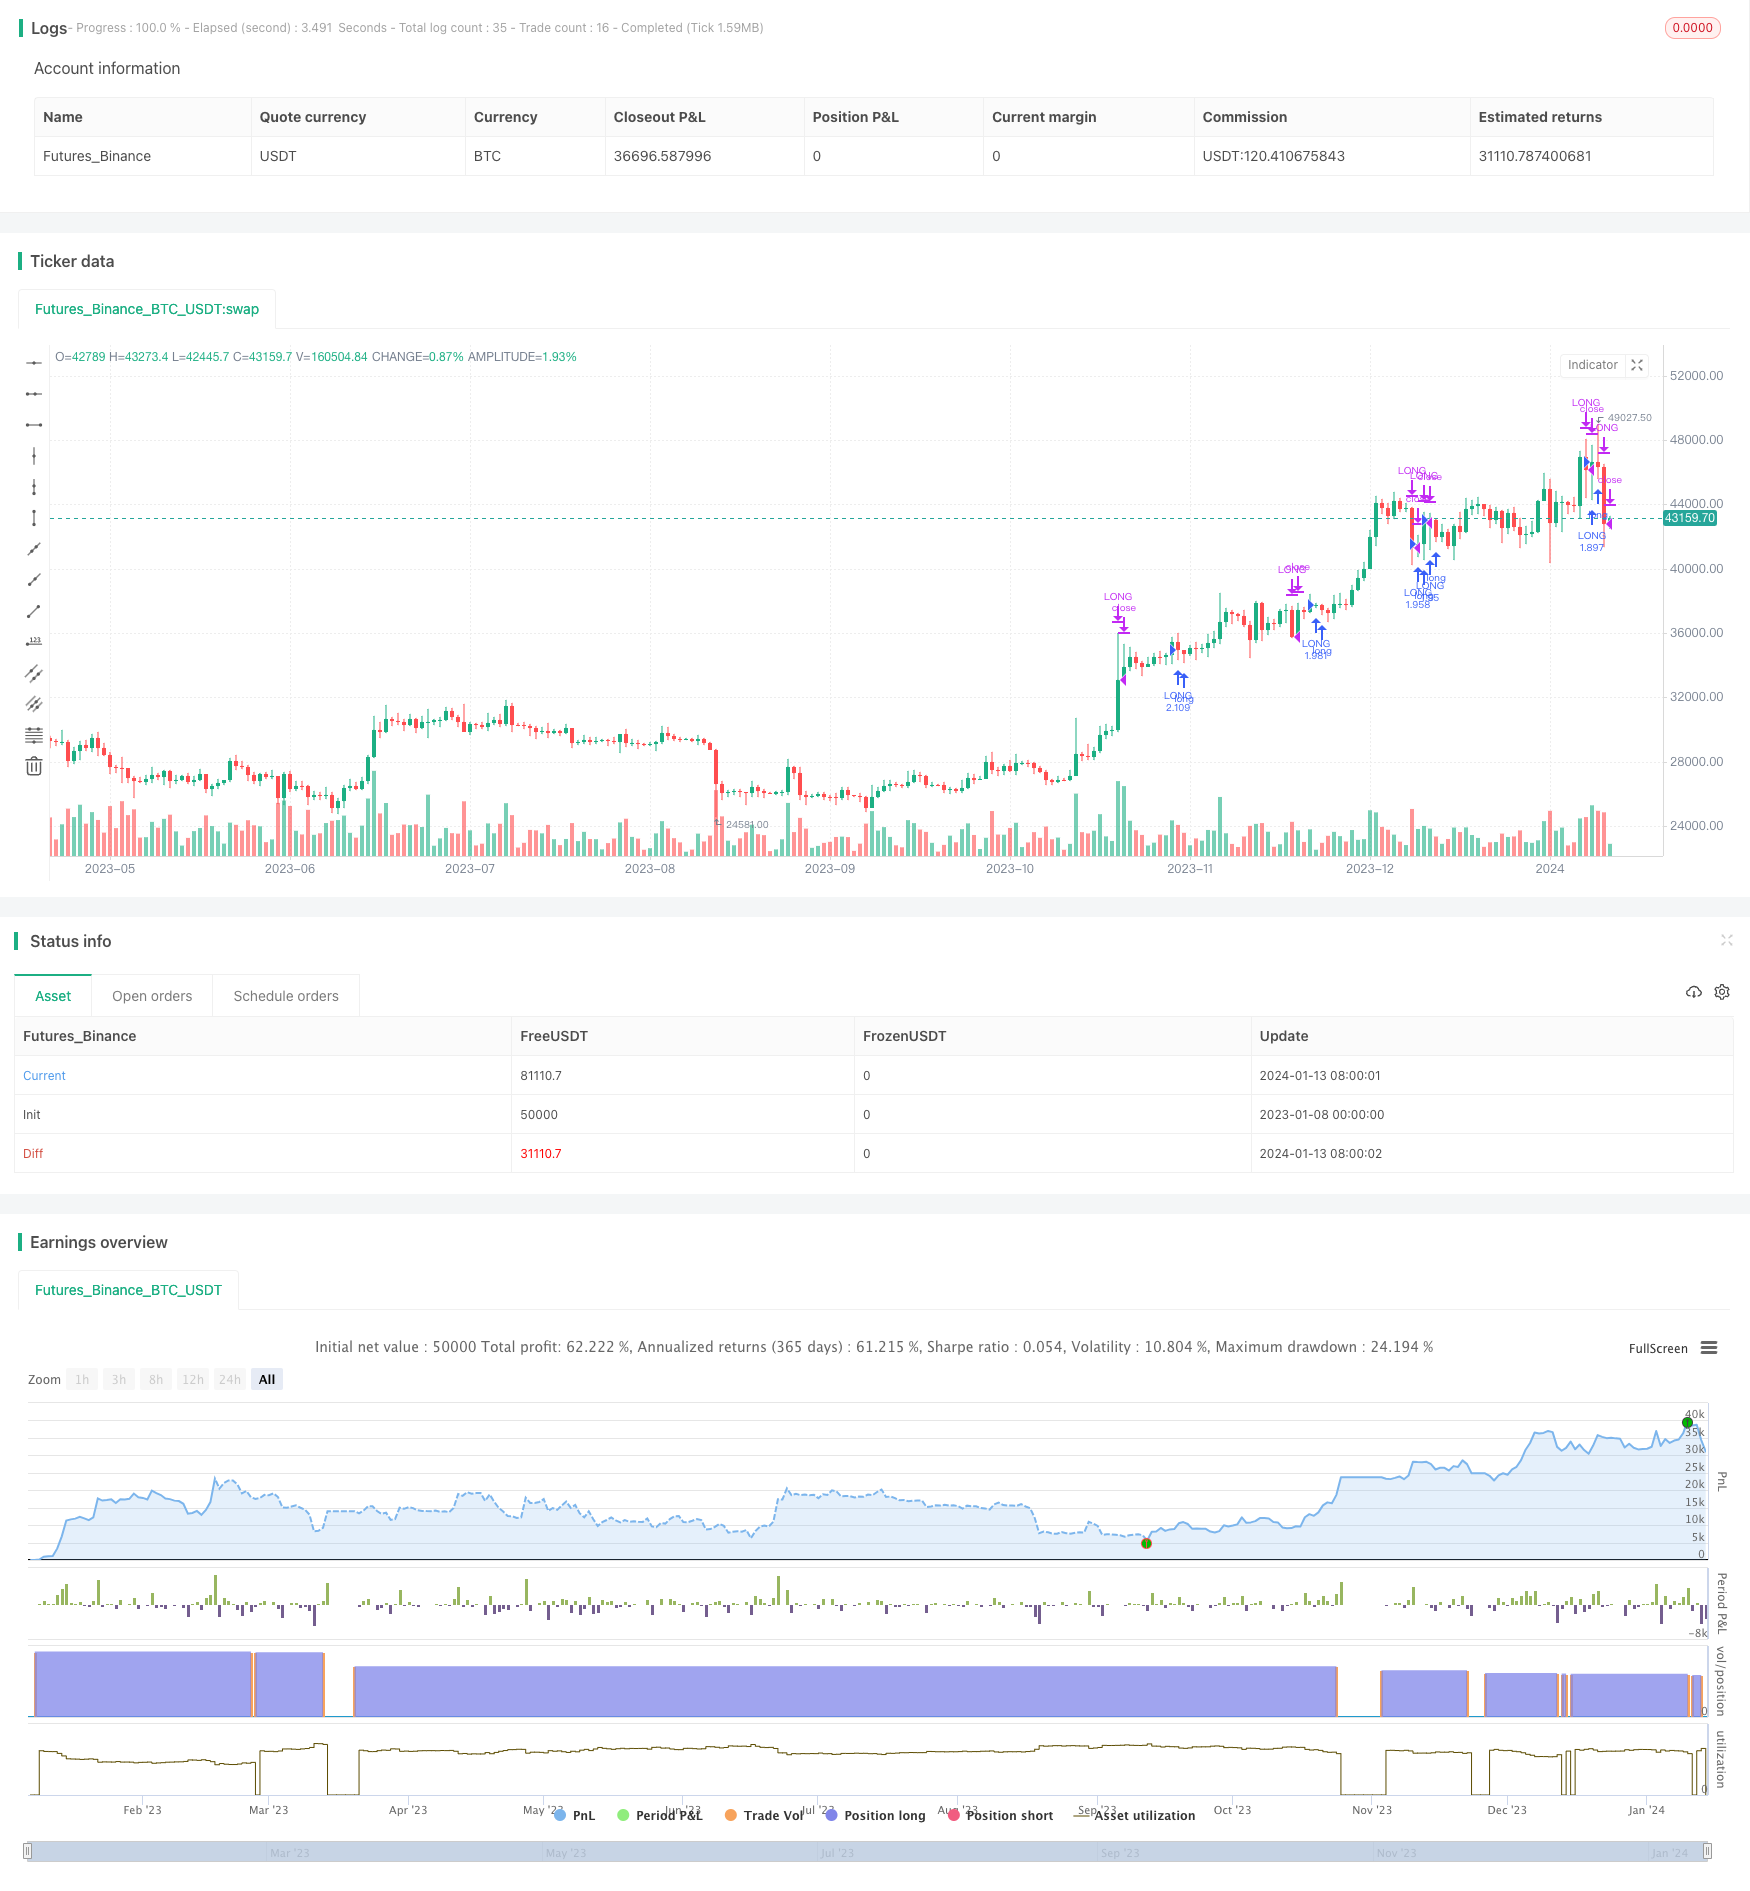
/*backtest
start: 2023-01-08 00:00:00
end: 2024-01-14 00:00:00
period: 1d
basePeriod: 1h
exchanges: [{"eid":"Futures_Binance","currency":"BTC_USDT"}]
*/

// This source code is subject to the terms of the Mozilla Public License 2.0 at https://mozilla.org/MPL/2.0/
//
// @author Sunil Halai
//
// This script has been created to demonstrate the effectiveness of using market regime filters in your trading strategy, and how they can improve your returns and lower your drawdowns
//
// This strategy adds a simple filter (The historical volatility filter, which can be found on my trading profile) to a traditional buy and hold strategy of the index SPY. There are other filters
// that could also be added included a long term moving average / percentile rank filter / ADX filter etc, to improve the returns further.
//
// The filter added closes our long position during periods of volatility that exceed the 95th percentile (or in the top 5% of volatile days)
//
// Have included the back test results since 1993 which is 28 years of data at the time of writing,  Comparing  buy and hold of the SPY (S&P 500), to improved by and hold offered here.
//
// Traditional buy and hold:
//
// Return per year:     7.95   % (ex Dividends)
// Total return :       851.1  %
// Max drawdown:        50.79  %
//
// 'Modified' buy and hold (this script):
//
// Return per year:     9.92    % (ex Dividends)
// Total return:        1412.16 %
// Max drawdown:        31.57   %
//
// Feel free to use some of the market filters in my trading profile to improve and refine your strategies further, or make a copy and play around with the code yourself. This is just
// a simple example for demo purposes.
//

//@version=4
strategy(title = "Simple way to beat the market [STRATEGY]", shorttitle = "Beat The Market [STRATEGY]", overlay=true, initial_capital=100000, default_qty_type=strategy.percent_of_equity, currency="USD", default_qty_value=100)


upperExtreme = input(title = "Upper percentile filter (Do not trade above this number)", type = input.integer, defval = 95)
lookbackPeriod = input(title = "Lookback period", type = input.integer, defval = 100)

annual = 365
per = timeframe.isintraday or timeframe.isdaily and timeframe.multiplier == 1 ? 1 : 7
hv = lookbackPeriod * stdev(log(close / close[1]), 10) * sqrt(annual / per)

filtered = hv >= percentile_nearest_rank(hv, 100, upperExtreme)

if(not(filtered))
    strategy.entry("LONG", strategy.long)
else
    strategy.close("LONG")