ロングショートバランス移動平均トレンドフォロー戦略
概要
この戦略は,ビットコインとイーサリアムに適用されるシンプルな移動平均のトレンドフォロー戦略である.これは,平均線,MACD,およびRSIなどの複数の指標を組み合わせて,トレンドの方向を識別し,固定ポジションの長線を保持してトレンドを追跡する.
戦略原則
戦略の核心的な論理は,20日EMA線で100日SMA線を突破し,100日SMA線で200日SMA線を突破したときに多めにすること.20日EMA線の下で100日SMA線を突破したときに平仓すること.すなわち,3つの異なる期間の移動平均を使用してトレンドの方向を決定すること.
具体的には,戦略は,20日EMA線,100日SMA線,200日SMA線の値を計算し,それらの大きさの関係を比較してトレンドを判断する.20日EMA線に100日SMA線,すなわち20日EMA線が100日SMA線より大きい線を穿えると,価格が上昇し始めていることを示し,このとき,100日SMA線も200日SMA線より大きい場合は,中長期のトレンドも上昇していることを示し,これはより強い多行シグナルである.
多ポジションに入ってから,戦略はポジションを保持し,トレンドの実行に従います. 20日目EMA線が100日目SMA線を下回って再突破すると,短期的な傾向が反転信号を示し,戦略は平仓のストップを選択します.
さらに,戦略はMACDとRSIなどの指標を組み合わせてトレンドを確認します. MACDのDIF線,DEMA線,HIST柱状線が上昇しているときにのみ,RSI指標が50を超えているときに,ポジションをさらに開くことを選択します.
戦略的優位性
この戦略の最大の利点は,明瞭なトレンド取引ルールを制定し,中長線トレンドを効果的に追跡できることです.具体的利点は以下の通りです.
- 複数の移動平均を用いてトレンドを判断する方が信頼性が高い.
- 長期にわたる市場波動に気まずく,トレンドの動きを追跡する.
- MACDとRSIなどの指標と組み合わせた戦略信号確認により,偽のブレイクをフィルターすることができます.
- エマ線とSMA線の金叉と死叉で入場と出場のポイントを判断し,規則は単純明快である.
- リスクを効果的にコントロールし,ストップ・ロスを利用して損失を制限する.
リスクと解決
この戦略にはいくつかのリスクがあります. 主な問題は,トレンドが逆転したときに,間に合うように停止できないことです. 具体的リスクと解決策は以下の通りです.
トレンドの逆転点に間に合わない場合:平均周期を短くするか,より多くの指標を追加して総合判断を行うことができます.
長期にわたって持っていたら,大きな損失を招く可能性が高い.出場ラインを適切に短縮し,損失を間に合うように止めてしまう.
平均線指数は遅滞に容易である:一定引き戻し比率のストップラインを追加し,積極的なストップローを行うことができる.
最適化の方向
この戦略は,以下の点で最適化できます.
より多くの組み合わせの平均線周期をテストし,最適なパラメータを探します.
他の指標やモデルでトレンドや入場時期を判断してみてください. ブリン帯,KD指標などです.
機械学習などの方法による動的最適化パラメータ.例えば,強化学習を用いたストップ損失幅の調整.
取引量指標と組み合わせて偽突破を避ける.例えば,エネルギー潮指標,取引量など.
市場状況に応じてストップポジションを調整できる自動ストップとストップ追跡システムを開発.
要約する
この戦略は,全体的にシンプルで直接的なトレンドフォロー戦略である.移動平均を使用してトレンドの方向を判断し,MACDとRSIのフィルター信号を使用している.長い持久時間のトレンドフォローを採用している.中長期トレンドの機会を効果的に把握することができる.同時に,遅れのトレンドの逆転の危険性もあります.将来,パラメータの最適化,指標の追加などによって改善およびアップグレードすることができます.
/*backtest
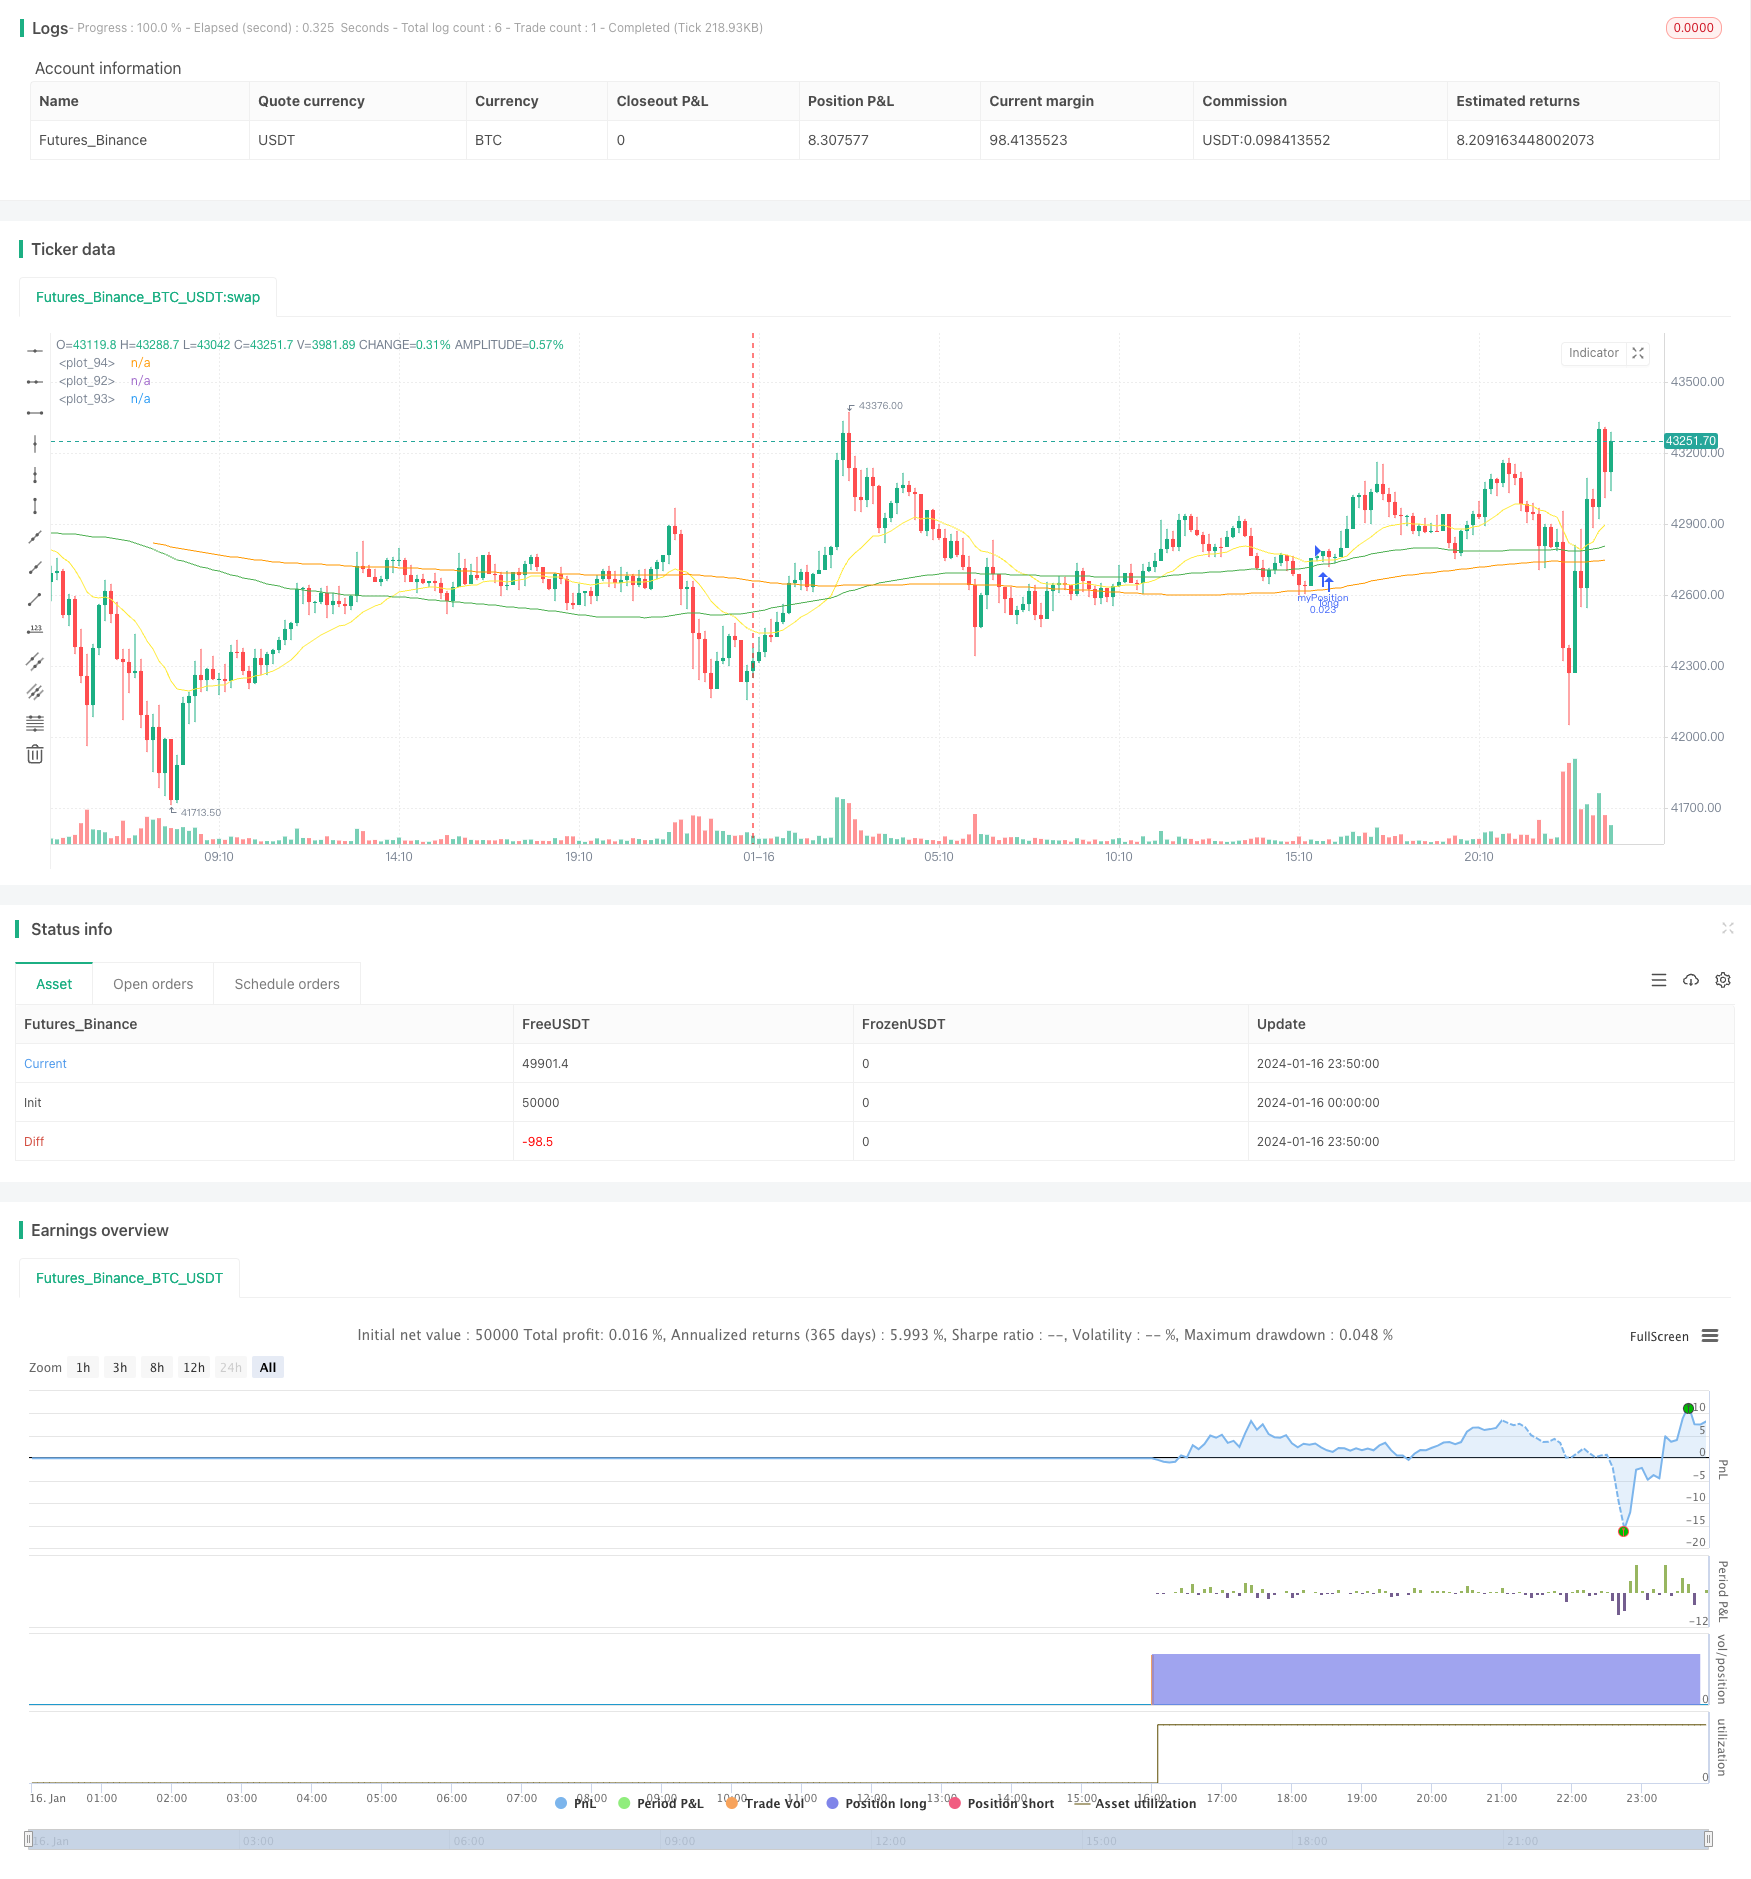
start: 2024-01-16 00:00:00
end: 2024-01-17 00:00:00
period: 10m
basePeriod: 1m
exchanges: [{"eid":"Futures_Binance","currency":"BTC_USDT"}]
*/
//@version=4
strategy(title="BTC_Long_Only_TV01_200507", overlay=true)
//////////// !!!!!!!!!!!!!!!! WORK BEST IN 2 HOURS for BTC, ETH and ETHXBT !!!!!!!!!!!!!!!!!!! /////////////////////
//280820 - After long esting this is the best script for ETHUSD in 4 hours. From 01/01/2020 til 28/08/2020
[macdLine, macdSignalLine, macdHist] = macd(close, 12, 26, 7)
//_rsi_len = input(14, title="RSI length")
_rsi_len = 14
NewValue = 0
PreviousValue = 0
leverage = 1
smaPercentageIncrease = 0.0
SMA_PERCENT_INCREASE = 0.0
float atrValue = 0
bool bPositionOpened = false
float stockPositionSize = 0
float volatilityPercentage = 0.0
bool bDisplayArrow = false
bool bEMAIsRising = false
bool bSMAIsRising = false
bool bSMASlowIsRising = false
bool bMACDIsRising = false
bool bMACDHistIsRising = false
bool bMACDSignalIsRising = false
float stopLoss = input (5, "StopLoss in %", type=input.float) //StopLoss associated with the order
//Best for alt versus BTC float stopLoss = input (3, "StopLoss in %", type=input.float) //StopLoss associated with the order
float positionSize = 1000
float currentPrice = close
float stopLossPrice = 0
float entryPrice = 0
//-----------------------------------------------------------
// === INPUT BACKTEST RANGE ONE YEAR
//FromDay = input(defval = 01, title = "From Day", minval = 1, maxval = 31)
//FromMonth = input(defval = 01, title = "From Month", minval = 1, maxval = 12)
//FromYear = input(defval = 2020, title = "From Year", minval = 2017)
FromDay = 01
FromMonth = 01
FromYear = 2020
//ToDay = input(defval = 01, title = "To Day", minval = 1, maxval = 31)
//ToMonth = input(defval = 01, title = "To Month", minval = 1, maxval = 12)
//ToYear = input(defval = 2023, title = "To Year", minval = 2017)
ToDay = 14
ToMonth = 05
ToYear = 2029
// === FUNCTION EXAMPLE ===
start = timestamp(FromYear, FromMonth, FromDay, 00, 00) // backtest start window
finish = timestamp(ToYear, ToMonth, ToDay, 23, 59) // backtest finish window
window() => true // create function "within window of time"
//FUNCTION DEFINITIONS
//----------------------
IsRising(data, loopBack) =>
bIsRising = true
for n = 1 to loopBack
if data[n] > data[n-1]
bIsRising := false
continue
bIsRising
IsFalling(data, loopBack) =>
bIsFalling = true
for n = 1 to loopBack
if data[n] < data[n-1]
bIsFalling := false
continue
bIsFalling
// END OF FUNCTION DEFINITIONS //
emaLength = 20
smaLength = 100
smaSlowLength = 200
ema = ema(close, emaLength)
sma = sma(close, smaLength)
smaSlow = sma(close, smaSlowLength)
plot(sma, color=color.green)
plot(smaSlow, color=color.orange)
plot(ema, color=color.yellow)
//reload previous values
stopLossPrice := na(stopLossPrice[1]) ? 0.0 : stopLossPrice[1]
entryPrice := na(entryPrice[1]) ? 0.0 : entryPrice[1]
bPositionOpened := na(bPositionOpened[1]) ? false : bPositionOpened[1]
positionSize := na(positionSize[1]) ? 1000 : positionSize[1]
stockPositionSize := na(stockPositionSize[1]) ? 0 : stockPositionSize[1]
//leverage := na(leverage[1]) ? 1 : leverage[1]
bEMAIsRising := IsRising(ema, 2)
bSMAIsRising := IsRising(sma, 3)
bMACDIsRising := IsRising(macdLine, 3)
bMACDHistIsRising := IsRising(macdHist, 1)
bSMASlowIsRising := IsRising(smaSlow, 10)
bMACDSignalIsRising := IsRising(macdSignalLine, 3)
atrValue := atr(14)
volatilityPercentage := (atrValue/currentPrice)*100 //calcute the volatility. Percentage of the actual price
if (window())
//Check if we can open a LONG
if (bPositionOpened == false and bSMASlowIsRising == true and bMACDIsRising == true and bEMAIsRising == true and bSMAIsRising == true and ema[0] > sma[0] and sma[0] < currentPrice)
//Enter in short position
stockPositionSize := (positionSize*leverage)/currentPrice //Calculate the position size based on the actual price and the position Size (in $) configured.
//calculate exit values
stopLossPrice := currentPrice*(1-stopLoss/100)
strategy.entry("myPosition", strategy.long, qty=stockPositionSize, comment="BUY at " + tostring(currentPrice))
entryPrice := currentPrice //store the entry price
bPositionOpened := true
bDisplayArrow := true
if (bPositionOpened == true and (currentPrice <= stopLossPrice or crossunder(ema[1], sma[1])))
strategy.close("myPosition", comment="" + tostring(currentPrice) ) //Stop
//uncomment the below line to make the bot investing the full portfolio amount to test compounding effect.
//positionSize := positionSize + ((stockPositionSize * currentPrice) - (positionSize*leverage))
//reset some flags
bPositionOpened := false
bDisplayArrow := true
entryPrice := 0.0