ドンチャンチャネルブレイクアウトトレンドフォロー戦略
概要
唐津チャネルブレイク戦略は,一定期間中の最高価格と最低価格を計算することで価格チャネルを形成し,チャネル境界を買入・売却の信号として使用するトレンド追跡戦略である.価格が上線を突破すると空き,下線を突破すると多めにする.この戦略は,高波動の仮想通貨取引に適用される.
戦略原則
この戦略は,価格の傾向を判断し,入場・退出点を計算するために唐通路の指標を使用する.唐通路は,上線,下線,中線で構成されている.上線は,一定の周期における最高価格,下線は最低価格,中線は平均価格である.
入場と退出周期の長さは,個別に配置できます。価格が上方突破下軌道を突破するとき,多入場を行います;価格が下方突破上軌道を突破するとき,空き入場を行います。退出点は,価格が再び対応する軌道を触れるためになります。また,中軌道を損失線として使用することも選択できます。
さらに,戦略には止まり点も設定されている.多ポジションの止まり価格は入場価格 ((1+止まり価格の比率),空白ポジションは逆である.この機能を有効にすると,利益をロックし,損失拡大を防ぐことができる.
全体として,この戦略は,トレンドを判断しながら,ストップとストップを設定する十分なスペースを確保します.これは,デジタル通貨などの波動性の高い品種に特に適しています.
優位分析
この戦略の利点は以下の通りです.
- 戦略的判断は明確で,信号生成はシンプルで信頼性があります.
- 唐通道指数は価格変動に敏感で,トレンドを捉えるのに役立ちます.
- カスタマイズ可能な通路パラメータは,異なる品種と時間周期に対応します.
- 内蔵の止損防止機能により,危険を効果的に制御できます.
- デジタル通貨などの高変動品種に適用され,収益の可能性が高い.
リスク分析
この戦略には以下のリスクもあります.
- 市場を完全に回避することは不可能です.
- パラメータを正しく設定しない場合,取引頻度が高くなり,取引コストが高くなり,滑り込みのリスクが高くなります.
- この戦略は価格の変動に敏感で,取引の機会を逃す可能性があります.
上記のリスクを抑えるために,以下の措置を講じます.
- 単一投資を適切に削減し,投資品種を分散し,全体的なリスクを制御する.
- パラメータを最適化して,最適なパラメータの組み合わせを探します. 機械学習などの方法を採用して自動最適化を試みることができます.
- 突破信号の信頼性を判断する追加指標と組み合わせて,誤った取引を避ける.
最適化の方向
この戦略は,以下の側面からさらに最適化できます.
- より多くのパラメータの組み合わせをテストして最適化し,最適なパラメータを探します.主なパラメータには,通路周期,止まり率,余分な空き空きが許可されるかどうかなどがあります.
- 機械学習モデルを追加し,最適パラメータを自動的に識別する. 強化学習などの方法が適用できる.
- 平均線,取引量など,他の指標と組み合わせてトレンドと信号の信頼性を判断する.
- ストップ・ストップ・トラッキング,シャンデリア・エグジットなどのストップ・ストップ戦略を開発し,リスクをさらにコントロールする.
- この戦略に最も適合する取引品種を探し出すために,より多くの品種に拡大する.
要約する
唐津通路突破戦略は,全体的に判断が明確で,リスクが制御可能なトレンド追跡戦略である.これは,収益の潜在性のあるデジタル通貨などの高変動品種に特に適している.同時に,この戦略には,特定のパラメータの最適化スペースがあり,他の指標と組み合わせる可能性もあります.これらは,将来的に拡張可能な方向です.この戦略は,継続的な最適化と革新により,デジタル通貨アルゴリズム取引の重要な選択肢になる可能性があります.
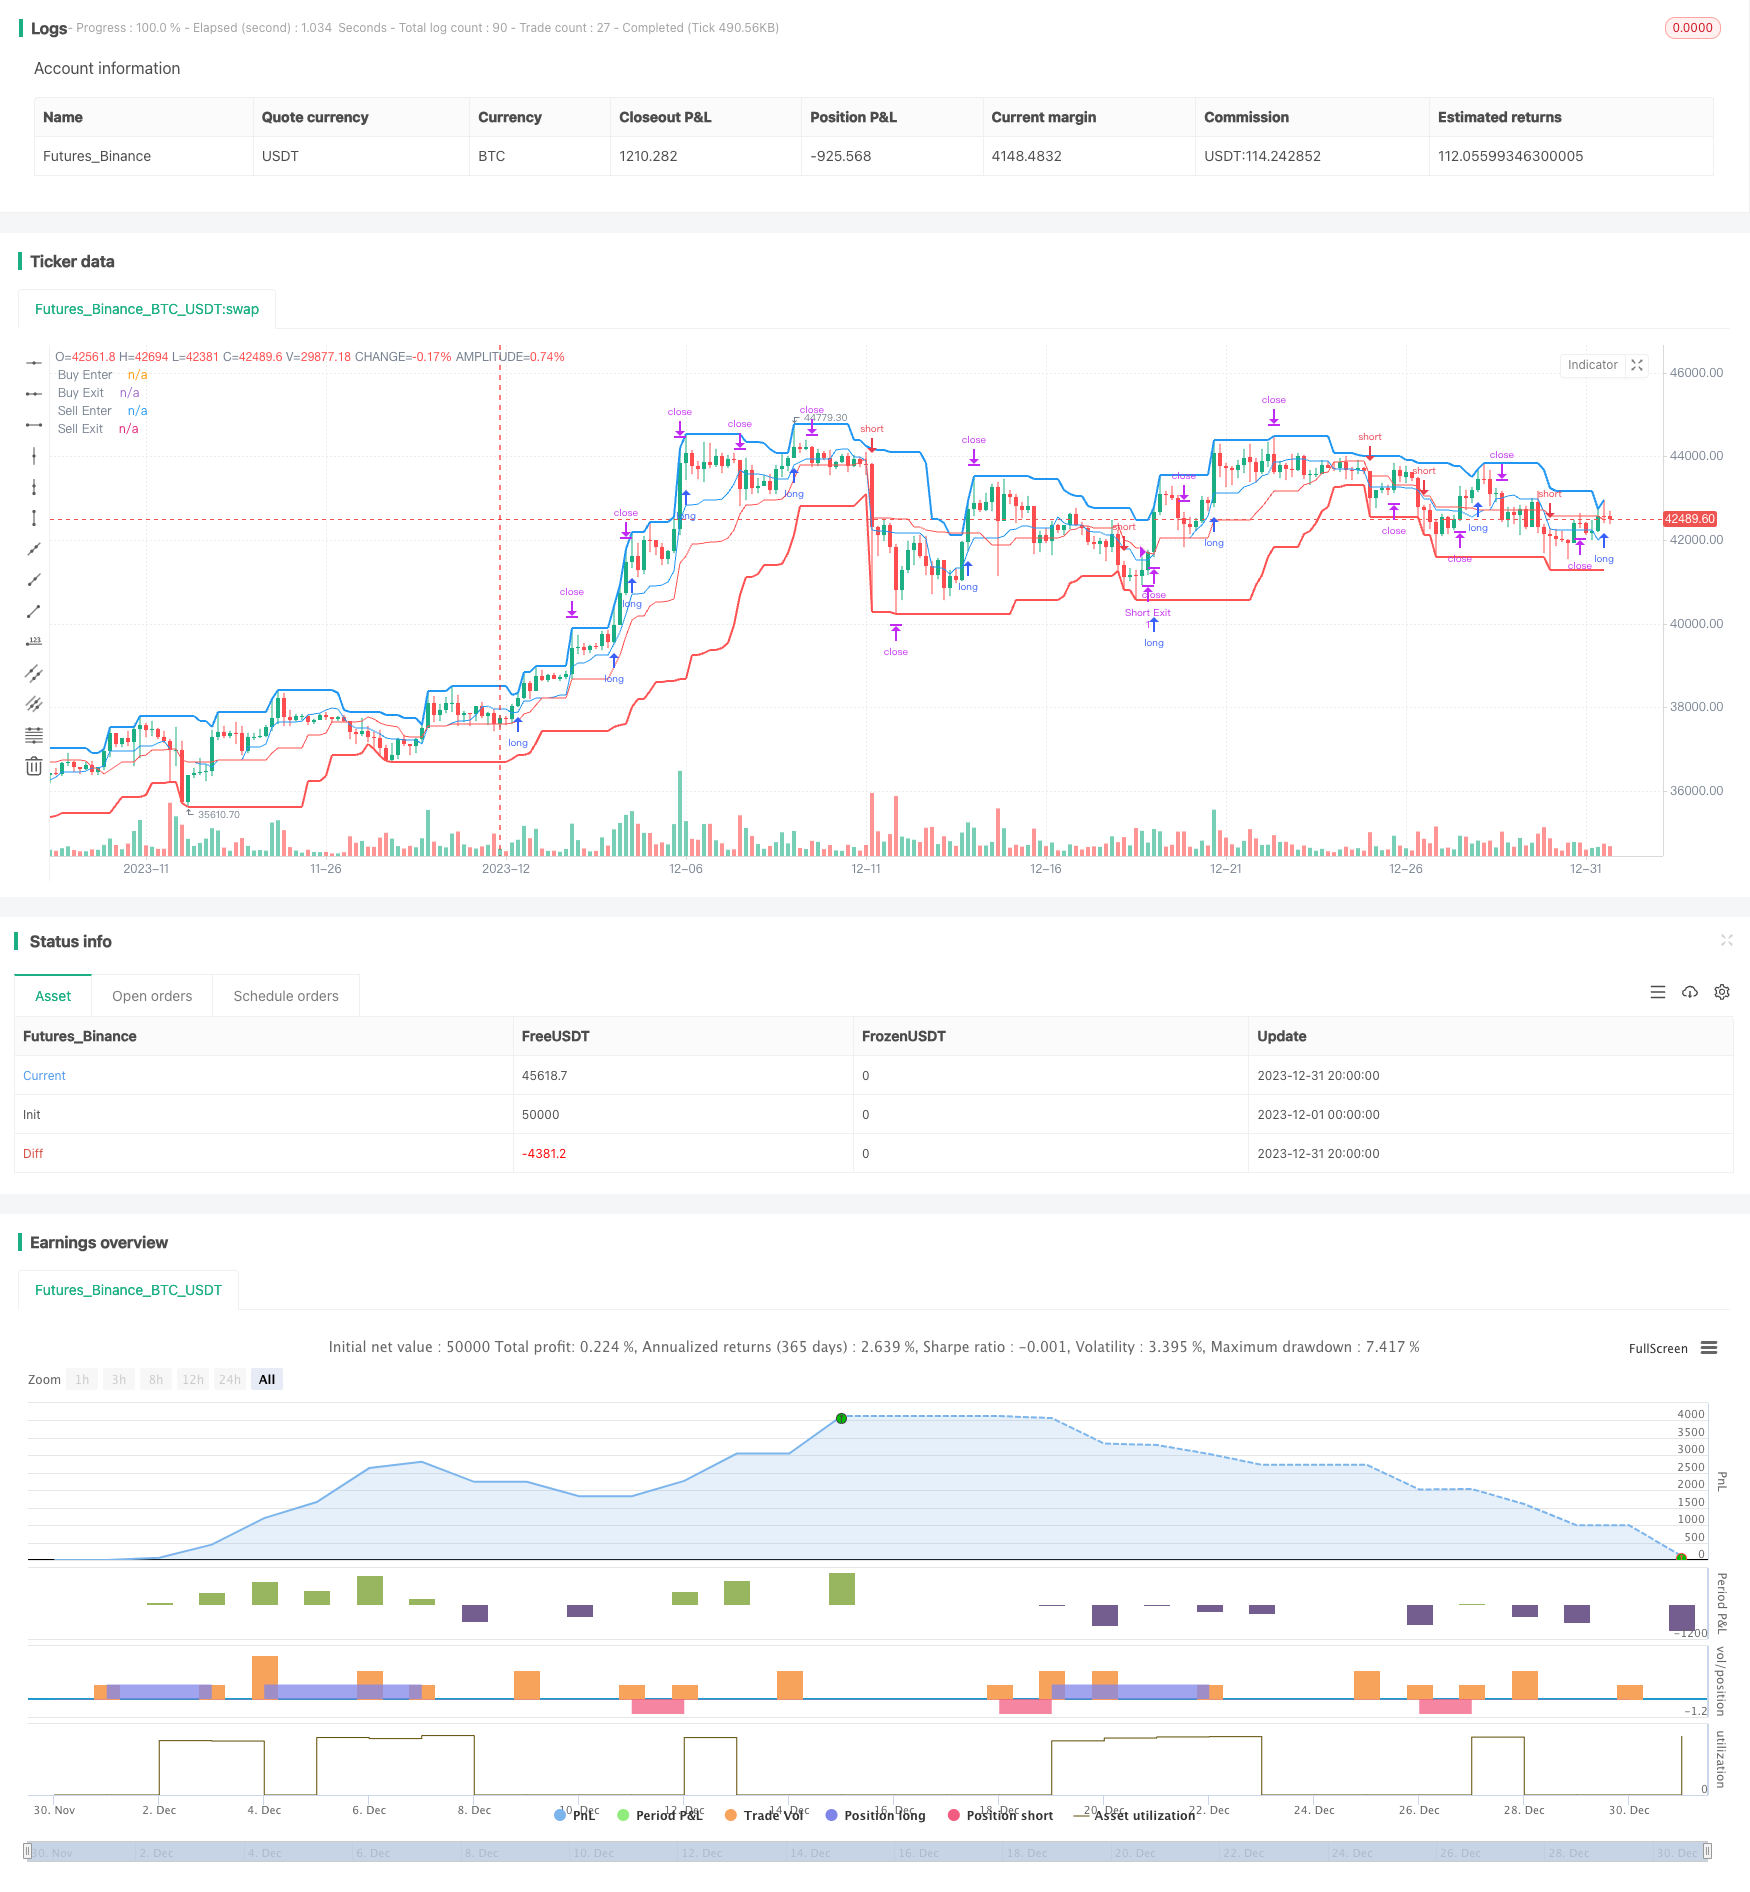
/*backtest
start: 2023-12-01 00:00:00
end: 2023-12-31 23:59:59
period: 4h
basePeriod: 15m
exchanges: [{"eid":"Futures_Binance","currency":"BTC_USDT"}]
*/

// This source code is subject to the terms of the Mozilla Public License 2.0 at https://mozilla.org/MPL/2.0/
// © algotradingcc
// Strategy testing and optimisation for free trading bot

//@version=4
strategy("Donchian Channel Strategy [for free bot]", overlay=true )

//Long optopns
buyPeriodEnter = input(10, "Channel Period for Long enter position")
buyPeriodExit = input(10, "Channel Period for Long exit position")
isMiddleBuy = input(true, "Is exit on Base Line? If 'no' - exit on bottom line")
takeProfitBuy = input(2.5, "Take Profit (%) for Long position")
isBuy = input(true, "Allow Long?")

//Short Options
sellPeriodEnter = input(20, "Channel Period for Short enter position")
sellPeriodExit = input(20, "Channel Period for Short exit position")
isMiddleSell = input(true, "Is exit on Base Line? If 'no' - exit on upper line")
takeProfitSell = input(2.5, "Take Profit (%) for Short position")
isSell = input(true, "Allow Short?")

// Test Start
startYear = input(2005, "Test Start Year")
startMonth = input(1, "Test Start Month")
startDay = input(1, "Test Start Day")
startTest = timestamp(startYear,startMonth,startDay,0,0)

//Test End
endYear = input(2050, "Test End Year")
endMonth = input(12, "Test End Month")
endDay = input(30, "Test End Day")
endTest = timestamp(endYear,endMonth,endDay,23,59)

timeRange = time > startTest and time < endTest ? true : false

// Long&Short Levels
BuyEnter = highest(buyPeriodEnter)
BuyExit = isMiddleBuy ? ((highest(buyPeriodExit) + lowest(buyPeriodExit)) / 2): lowest(buyPeriodExit)

SellEnter = lowest(sellPeriodEnter)
SellExit = isMiddleSell ? ((highest(sellPeriodExit) + lowest(sellPeriodExit)) / 2): highest(sellPeriodExit)

// Plot Data
plot(BuyEnter, style=plot.style_line, linewidth=2, color=color.blue, title="Buy Enter")
plot(BuyExit, style=plot.style_line, linewidth=1, color=color.blue, title="Buy Exit", transp=50)
plot(SellEnter, style=plot.style_line, linewidth=2, color=color.red, title="Sell Enter")
plot(SellExit, style=plot.style_line, linewidth=1, color=color.red, title="Sell Exit", transp=50)

// Calc Take Profits
TakeProfitBuy = 0.0
TakeProfitSell = 0.0
if strategy.position_size > 0
    TakeProfitBuy := strategy.position_avg_price*(1 + takeProfitBuy/100)

if strategy.position_size < 0
    TakeProfitSell := strategy.position_avg_price*(1 - takeProfitSell/100)

// Long Position
if isBuy and timeRange
    strategy.entry("Long", strategy.long, stop = BuyEnter, when = strategy.position_size == 0)

strategy.exit("Long Exit", "Long", stop=BuyExit, limit = TakeProfitBuy, when = strategy.position_size > 0)

// Short Position
if isSell and timeRange
    strategy.entry("Short", strategy.short, stop = SellEnter, when = strategy.position_size == 0)

strategy.exit("Short Exit", "Short", stop=SellExit, limit = TakeProfitSell, when = strategy.position_size < 0)

// Close & Cancel when over End of the Test
if time > endTest
    strategy.close_all()
    strategy.cancel_all()