モメンタムブレイクアウトシルバーライン戦略
概要
この戦略は,価格動態指標MACDと均線に基づく突破買い戦略で,銀 ((XAG/USD,XAG/EUR) の1時間の時間周期に適用されます.
戦略原則
MACD柱状線が負の正転と連続した上昇で突破信号線を打つとき,短期的な強気を示します.また,閉盘価格が上昇傾向の平均線を突破した場合,多頭信号が生じます.同様に,MACD柱状線が負の正転と信号線を突破し,閉盘価格が下降傾向の平均線を突破したとき,空頭信号が生じます.
この戦略では,次の条件を考慮して,長期投資の入場シグナルを判断します.
- MACDの柱は正の線で
- 縦軸は,前列より高い
- 平均値より高い閉店価格
- 閉店価格は,K線近3線の最高値より高い.
ショートポジションの入場シグナルを判断する条件は正反対である.
一旦開いたポジションは,次のK線の閉店時に無条件平仓する.この戦略は,ストップ・ストップ・損失のポイントを設定せず,トレンドの勃発の開始点を捕捉しようとする.
優位分析
この戦略は,価格と動力の指標を組み合わせて,トレンドが逆転するタイミングをより正確に判断することができ,勝利率が高くなります.無条件のK線をクローズアップする平衡方法は,逆転が失敗した後に再び損失を回避することができます.
投資家の需要に応えるため,ストップ・ロスを設定せず,全額で取引を開始する.
リスク分析
止損のない設定は,容易に閉じ込められ,損失のリスクが高い.逆転信号が失敗し,間に合わない止損,大きな資金損失に直面する可能性がある.
K線を無条件に閉じて,平衡を保つのが難しいので,トレンドの利潤を継続的に捉えることは難しい.
最適化の方向
勝利率が高い突破買いに基づいて,適切なストップ・ローズ戦略を追加し,損失のリスクを低減することを考えることができます.
また,高度な技巧を組み合わせて,平仓の後に再開する仕組みを設定して,トレンドの利潤を継続的に捉えようとすることもできます.
要約する
この戦略は,全体的に積極的攻撃的な高リスク戦略であり,止損なしの設定のため,投資家が大きな損失のリスクを背負う必要がある.しかし,相対的に,成功裏に逆転した後の最初の時点で全ポジションを開設しても高額な利益を得ることができます.強い心理的耐性を持つ積極的な投資家に適しています.
/*backtest
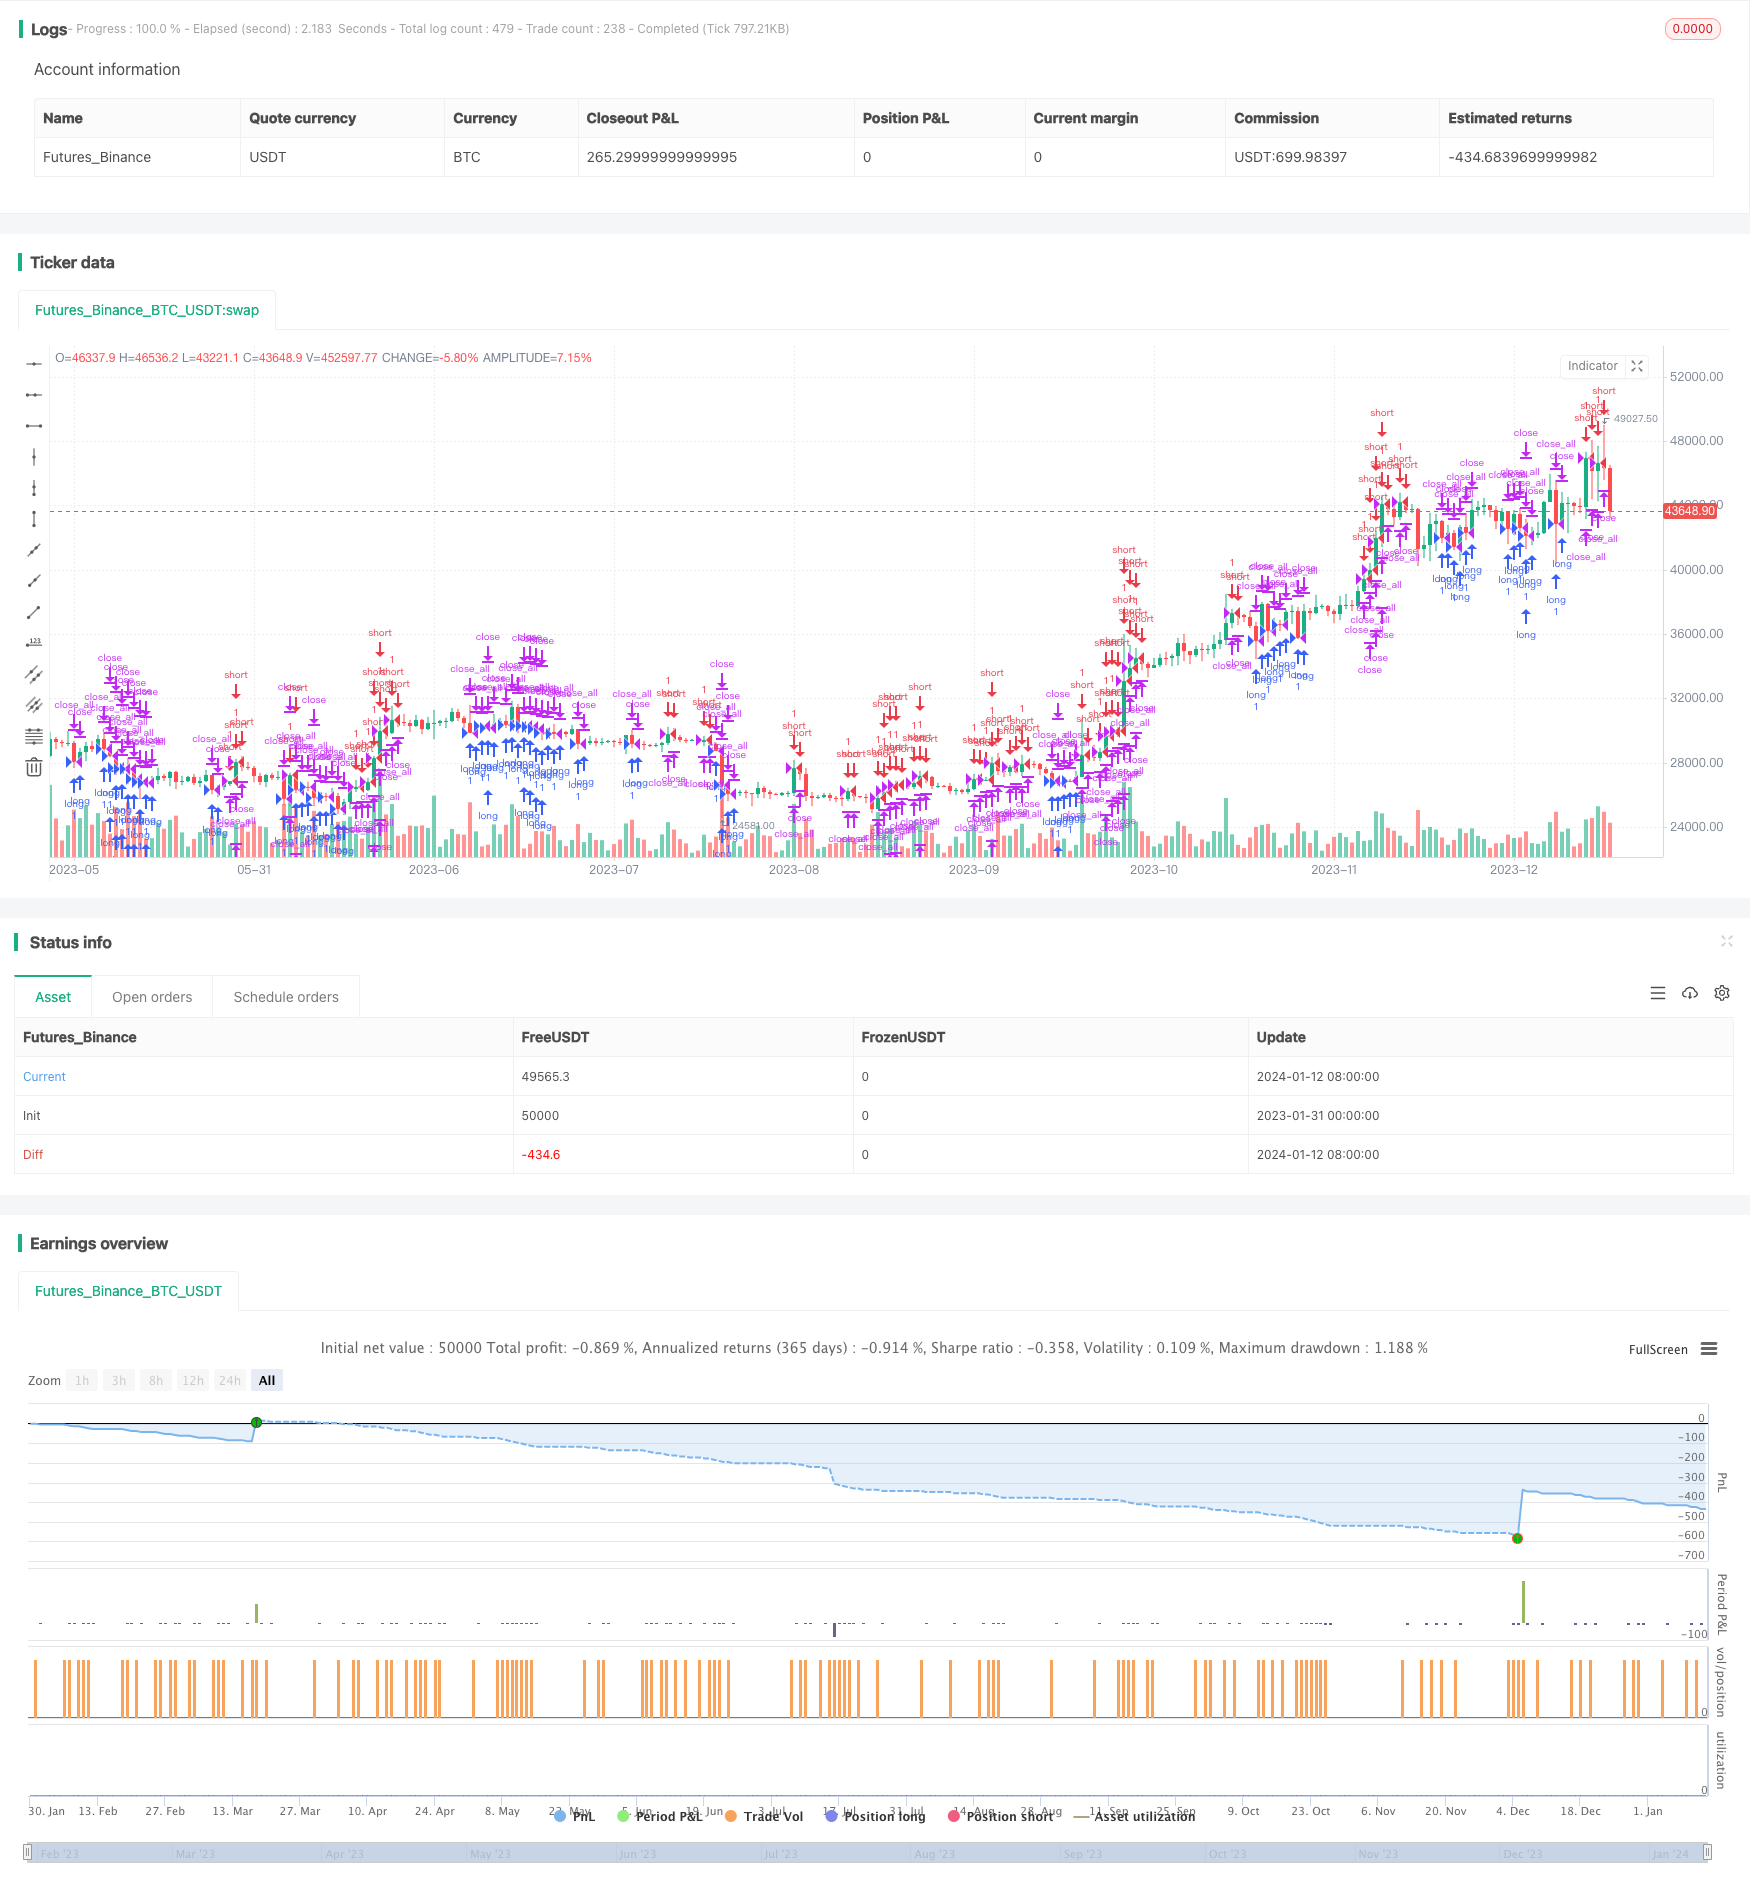
start: 2023-01-31 00:00:00
end: 2024-01-13 05:20:00
period: 1d
basePeriod: 1h
exchanges: [{"eid":"Futures_Binance","currency":"BTC_USDT"}]
*/
// This source code is subject to the terms of the Mozilla Public License 2.0 at https://mozilla.org/MPL/2.0/
// © SoftKill21
//@version=4
strategy("XAG strategy 1h",overlay=true)
fromDay = input(defval = 1, title = "From Day", minval = 1, maxval = 31)
fromMonth = input(defval = 1, title = "From Month", minval = 1, maxval = 12)
fromYear = input(defval = 2020, title = "From Year", minval = 1970)
var gica = 0
var marcel = gica+2
//monday and session
// To Date Inputs
toDay = input(defval = 31, title = "To Day", minval = 1, maxval = 31)
toMonth = input(defval = 12, title = "To Month", minval = 1, maxval = 12)
toYear = input(defval = 2020, title = "To Year", minval = 1970)
startDate = timestamp(fromYear, fromMonth, fromDay, 00, 00)
finishDate = timestamp(toYear, toMonth, toDay, 00, 00)
time_cond = true
len = input(10, minval=1, title="Length")
src = input(close, title="Source")
out = sma(src, len)
//distanta = input(1.004)
fast_length = input(title="Fast Length", type=input.integer, defval=12)
slow_length = input(title="Slow Length", type=input.integer, defval=26)
signal_length = input(title="Signal Smoothing", type=input.integer, minval = 1, maxval = 50, defval = 9)
sma_source = input(title="Simple MA(Oscillator)", type=input.bool, defval=false)
sma_signal = input(title="Simple MA(Signal Line)", type=input.bool, defval=false)
// Plot colors
col_grow_above = #26A69A
col_grow_below = #FFCDD2
col_fall_above = #B2DFDB
col_fall_below = #EF5350
col_macd = #0094ff
col_signal = #ff6a00
// Calculating
fast_ma = sma_source ? sma(src, fast_length) : ema(src, fast_length)
slow_ma = sma_source ? sma(src, slow_length) : ema(src, slow_length)
macd = fast_ma - slow_ma
signal = sma_signal ? sma(macd, signal_length) : ema(macd, signal_length)
hist = macd - signal
option1=input(true)
option2=input(true)
long2 = close > open and time_cond and close > out and hist > 0 and hist > hist[1]
short2 = close < open and time_cond and close < out and hist < 0 and hist < hist[1]
long1 = (close > open ) and time_cond and close > out and hist > 0 and hist > hist[1] and high > high[1] and high[1] > high[2] and close > high[1] and close > high[2] and close > high[3]
short1 = (close < open) and time_cond and close < out and hist < 0 and hist < hist[1] and low < low[1] and low[1] < low[2] and close < low[1] and close < low[2] and close < low[3]
if(option1)
strategy.entry("long",1,when= short1)
strategy.entry("short",0,when=long1)
strategy.close_all()
if(option2)
strategy.entry("long",1,when= short2)
strategy.entry("short",0,when=long2)
strategy.close_all()
// if(strategy.openprofit < 0)
// strategy.close_all()
// if(strategy.openprofit>0)
// strategy.close("long",when = close < open )
// strategy.close("short",when = close > open)
// strategy.close("long",when= close < open)
// strategy.close("short",when= close> open)
// tp = input(0.0003)
// sl = input(0.005)
// strategy.exit("closelong", "long" , profit = close * tp / syminfo.mintick, loss = close * sl / syminfo.mintick, alert_message = "closelong")
// strategy.exit("closeshort", "short" , profit = close * tp / syminfo.mintick, loss = close * sl / syminfo.mintick, alert_message = "closeshort")