
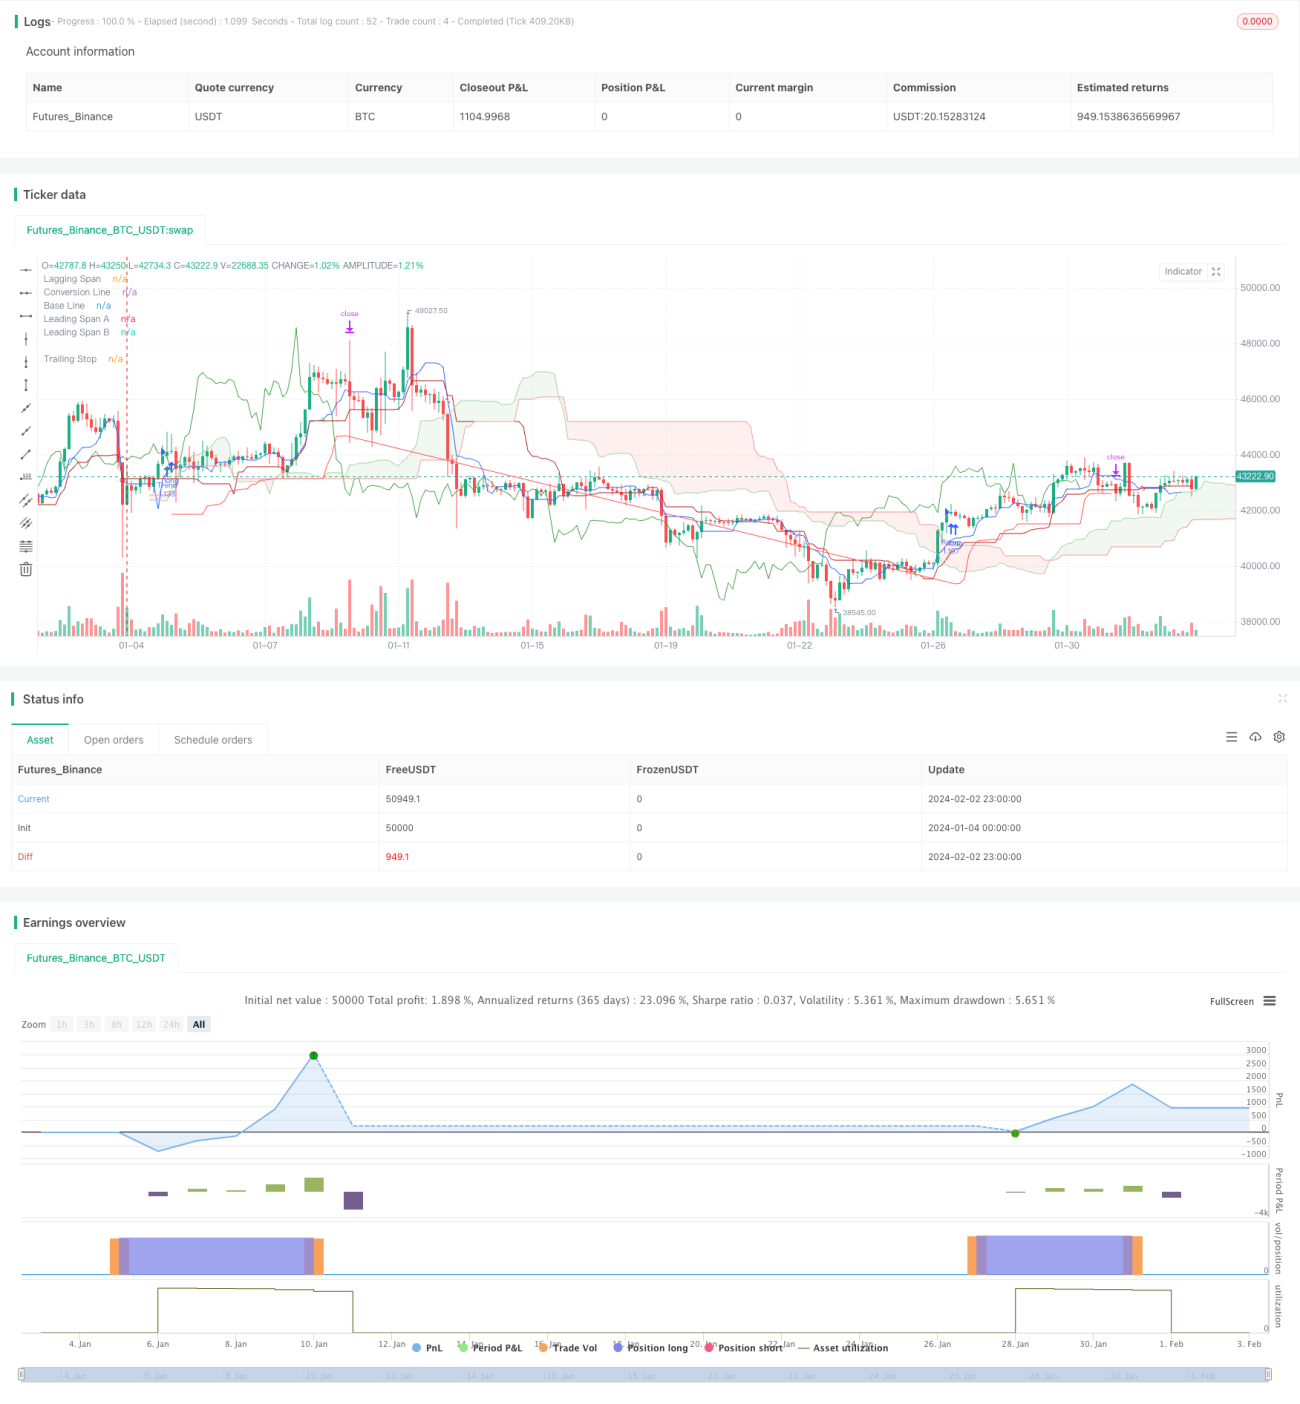
この戦略は,トレンド追跡戦略であり,潜在的突破機会を検出するために市場の多空力を判断するために,イチモク雲指標の配置を組み合わせている.重要な構成要素には,イチモク雲ベースの判断枠組み,ATRストップ,パーセンテージストップ,オプションのストップメカニズムが含まれている.
戦略の核心判断は2つの部分から構成され,一つは,市場多空力のトレンドシグナルをIchimokuクラウド指標に基づいて判断し,もう一つは,潜在的突破力の強いシグナルに基づいています.
トレンド判断には,複数のトレンドが形成されていることを示すコンバーションラインをベースラインに突破し,K線実体より高いラグジングスパンが現在の複数の力の強さを示すこと,クラウドの最高価格より高い価格が軌道上の突破を示す条件等を満たす必要があります.
強い信号については,同時に,雲の中で最低最高価格よりも高い価格が超強い力を表示し,コンバーションラインとベースラインが多頭で充満力を表示するなどの条件を満たす必要がある.
2種類の条件の任意のセットが触発されたとき,市場価格で単一のポジションを開く.その後,ATR,パーセント,またはイチモク雲指数のルールに基づいてストップロスの追跡を設定し,さらに利益をロックします.
この戦略の最大の利点は,Ichimoku雲の傾向判断と多空力評価機能を同時に利用することにある.単一の移動平均などの指標と比較して,Ichimoku雲は,現在の市場情勢の力対比を反映し,信号の正確性を向上させる.
また,ATRとパーセンテージ・ストップを組み合わせてリスクを管理することで,単一の損失をコントロールできます.また,選択可能なストップメカニズムにより,戦略的利益がより安定化されます.
策略の主要なリスクは,イチモク雲そのものが一定の遅滞性を持っていることにある.さらに,強烈な信号が追尾の特性として,策略が套用される確率を増加させることもあり得る.
遅滞の問題によるリスクを軽減するために,イチモク雲のパラメータ周期を適切に短縮することができる.強烈な信号が引き起こすリスクに対して,止損追跡の設定を強化する必要が求められる.
この戦略をさらに改善するには,以下の方法があります.
戦略の強さと適応性を判断するために,さまざまな市場のデータをテストします.
イチモククラウドのパラメータを最適化して,特定の市場状況に合わせて
突破信号の強さを判断するためのLSTMなどの深度学習アルゴリズムを試す
量能指数を加えれば,追いつくのを避ける可能性
この戦略は,イチモク雲の配置を活用して市場空空の判断力を統合し,潜在的なトレンドを捉える一方で,リスク管理も十分に考慮している.戦略の収益性と制御性を効果的にバランスしている.まだある程度の最適化余地があるが,全体的に非常に実用的なトレンド追跡戦略である.
/*backtest
start: 2024-01-04 00:00:00
end: 2024-02-03 00:00:00
period: 3h
basePeriod: 15m
exchanges: [{"eid":"Futures_Binance","currency":"BTC_USDT"}]
*/
// This source code is subject to the terms of the Mozilla Public License 2.0 at https://mozilla.org/MPL/2.0/
// © mikul_se
//@version=5
strategy("mikul's Ichimoku Cloud Strategy v 2.0", shorttitle="mikul's Ichi strat", overlay=true, margin_long=100, margin_short=100, default_qty_type = strategy.percent_of_equity, default_qty_value = 100)
// Strategy settings
strategySettingsGroup = "Strategy settings"
trailSource = input.string(title="Trail Source", defval="Lows/Highs", options=["Lows/Highs", "Close", "Open"], confirm=true, group=strategySettingsGroup)
trailMethod = input.string(title="Trail Method", defval="ATR", options=["ATR", "Percent", "Ichi exit"], confirm=true, tooltip="Ichi rules means it follows the rules of the Ichimoku cloud for exiting the trade.", group=strategySettingsGroup)
trailPercent = input.float(title="Trail Percent", defval=10, minval=0.1, confirm=true, group=strategySettingsGroup)
swingLookback = input.int(title="Lookback", defval=7, confirm=true, group=strategySettingsGroup)
atrPeriod = input.int(title="ATR Period", defval=14, confirm=true, group=strategySettingsGroup)
atrMultiplier = input.float(title="ATR Multiplier", defval=1.0, confirm=true, group=strategySettingsGroup)
addIchiExit = input.bool(false, "Add Ichimoku exit", "You can use this to add Ichimoku cloud exit signals on top of Percent or ATR", group=strategySettingsGroup)
useTakeProfit = input.bool(false, "Use Take Profit", confirm=true, group=strategySettingsGroup)
takeProfitPercent = input.float(title="Take Profit Percentage", defval=5, minval=0.1, confirm=true, group=strategySettingsGroup)
// Ichimoku settings
ichimokuSettingsGroup = "Ichimoku settings"
conversionPeriods = input.int(9, minval=1, title="Conversion Line Length", group=ichimokuSettingsGroup)
basePeriods = input.int(26, minval=1, title="Base Line Length", group=ichimokuSettingsGroup)
laggingSpan2Periods = input.int(52, minval=1, title="Leading Span B Length", group=ichimokuSettingsGroup)
displacement = input.int(26, minval=1, title="Lagging Span", group=ichimokuSettingsGroup)
delta = input.int(26, minval=1, title="Delta", group=ichimokuSettingsGroup)
donchian(len) => math.avg(ta.lowest(len), ta.highest(len))
conversionLine = donchian(conversionPeriods)
baseLine = donchian(basePeriods)
leadLine1 = math.avg(conversionLine, baseLine)
leadLine2 = donchian(laggingSpan2Periods)
uppercloud = leadLine1[displacement-1]
bottomcloud = leadLine2[displacement-1]
// Ichi exit variables and calculations
delta2 = delta-3
average(len) => math.avg(ta.lowest(len), ta.highest(len))
conversion_line = average(conversionPeriods)
base_line = average(basePeriods)
lead_line_a = math.avg(conversion_line, base_line)
lead_line_b = average(laggingSpan2Periods)
lagging_span = close
lead_line_a_delta = lead_line_a[delta]
lead_line_b_delta = lead_line_b[delta]
lagging_span_delta = lagging_span[delta]
prisgris = hlc3[delta]
prisgris2 = hlc3[delta2]
// Declare trailing price variable (stores our trail stop value)
var float trailPrice = na
float next_trailPrice = na
// Get required trailing stop variables
atrValue = ta.atr(atrPeriod) * atrMultiplier
swingLow = ta.lowest(low, swingLookback)
swingHigh = ta.highest(high, swingLookback)
// Ichi plotting
plot(conversionLine, color=#2962FF, title="Conversion Line")
plot(baseLine, color=#B71C1C, title="Base Line")
plot(close, offset=-displacement + 1, color=#43A047, title="Lagging Span")
p1 = plot(leadLine1, offset=displacement - 1, color=#A5D6A7, title="Leading Span A")
p2 = plot(leadLine2, offset=displacement - 1, color=#EF9A9A, title="Leading Span B")
fill(p1, p2, color=leadLine1 > leadLine2 ? color.rgb(67, 160, 71, 90) : color.rgb(244, 67, 54, 90))
// Plotting ichi crossover signals
ichiup = ta.crossover(conversionLine, baseLine)
ichidown = ta.crossover(baseLine, conversionLine)
plotshape(ichiup ? conversionLine : na, 'Ichi long 1', style=shape.circle, location=location.absolute, offset=0, color=#00ff00b0, size=size.tiny)
plotshape(ichidown ? conversionLine : na, 'Ichi short 1', style=shape.circle, location=location.absolute, offset=0, color=#ff1100c7, size=size.tiny)
// Pamp signal
signal5 = close > bottomcloud[displacement] and close > uppercloud[displacement] and close > high[displacement]
signal5b = close[1] <= bottomcloud[displacement+1] or close[1] <= uppercloud[displacement+1] or close <= high[displacement+1]
signal6 = close > bottomcloud and close > uppercloud and close > open
signal6b = close[1] <= bottomcloud[1] or close[1] <= uppercloud[1]
signal7 = leadLine1 > leadLine2
signal7b = leadLine1[1] <= leadLine2[1]
signal8 = conversionLine > baseLine
pamp = signal5 and signal6 and signal7 and signal8 and strategy.position_size == 0 and (signal5b or signal6b or signal7b)
// Trend signal
nsignal5 = close > close[displacement]
nsignal6 = close > bottomcloud and close > uppercloud and close > open
nsignal8 = ta.crossover(conversionLine, baseLine) and conversionLine > bottomcloud and conversionLine > uppercloud and baseLine > bottomcloud and baseLine > uppercloud
trend = nsignal5 and nsignal6 and nsignal8 and strategy.position_size == 0
plotshape(trend, style=shape.triangleup, location=location.belowbar, color=color.green)
if (trend or pamp)
trailPrice := na
strategy.entry(trend ? "Trend" : "Pamp", direction = strategy.long)
// Get trailing stop price
if trailMethod == "ATR"
next_trailPrice := switch trailSource
"Close" => strategy.position_size > 0 ? close - atrValue : close + atrValue
"Open" => strategy.position_size > 0 ? open - atrValue : open + atrValue
=> strategy.position_size > 0 ? swingLow - atrValue : swingHigh + atrValue
else if trailMethod == "Percent"
float percentMulti = strategy.position_size > 0 ? (100 - trailPercent) / 100 : (100 + trailPercent) / 100
next_trailPrice := switch trailSource
"Close" => close * percentMulti
"Open" => open * percentMulti
=> strategy.position_size > 0 ? swingLow * percentMulti : swingHigh * percentMulti
else
short_signal = (ta.crossunder(lagging_span, prisgris)) or ta.crossover(base_line, conversion_line) and ((close)) < ((lead_line_a)) or ta.crossunder(lagging_span, prisgris) or (ta.crossover(base_line, conversion_line) and ((lagging_span) < (lead_line_a)) and ((lagging_span) < (lead_line_b)))
if short_signal
strategy.close("Trend", "Ichi trend over")
strategy.close("Pamp", "Ichi pamp over")
alert("Sell")
if (addIchiExit)
short_signal = (ta.crossunder(lagging_span, prisgris)) or ta.crossover(base_line, conversion_line) and ((close)) < ((lead_line_a)) or ta.crossunder(lagging_span, prisgris) or (ta.crossover(base_line, conversion_line) and ((lagging_span) < (lead_line_a)) and ((lagging_span) < (lead_line_b)))
if short_signal
strategy.close("Trend", "Ichi trend over")
strategy.close("Pamp", "Ichi pamp over")
alert("Sell")
// Check for trailing stop update
if strategy.position_size != 0 and barstate.isconfirmed
if (next_trailPrice > trailPrice or na(trailPrice)) and strategy.position_size > 0
trailPrice := next_trailPrice
alert(message="Trailing Stop updated for " + syminfo.tickerid + ": " + str.tostring(trailPrice, "#.#####"), freq=alert.freq_once_per_bar_close)
if (next_trailPrice < trailPrice or na(trailPrice)) and strategy.position_size < 0
trailPrice := next_trailPrice
alert(message="Trailing Stop updated for " + syminfo.tickerid + ": " + str.tostring(trailPrice, "#.#####"), freq=alert.freq_once_per_bar_close)
// Draw data to chart
plot(strategy.position_size != 0 ? trailPrice : na, color=color.red, title="Trailing Stop")
// Take Profit
float profitTarget = strategy.position_avg_price * (1 + takeProfitPercent / 100)
// Exit trade if stop is hit
strategy.exit(id="trend Exit", from_entry="Trend", stop=trailPrice, limit=useTakeProfit ? profitTarget : na)
strategy.exit(id="pamp Exit", from_entry="Pamp", stop=trailPrice, limit=useTakeProfit ? profitTarget : na)
if strategy.position_size == 0
trailPrice = 0