ストキャスティクス指標に基づく周期的オプション取引戦略
作成日:
2024-02-04 15:14:43
最終変更日:
2024-02-04 15:14:43
コピー:
3
クリック数:
784
1
フォロー
1750
フォロワー
概要
ストキャスティック指数に基づく周期的なオプション取引戦略と呼ばれるこの戦略は,オプション取引の潜在的入場と退出点を識別するためにストキャスティック振動指数を使用します.この戦略はオプション取引に専用であり,多空の両端で取引機会を識別できます.
戦略原則
この戦略は,14周期のストカスティック%K線と3周期のシンプル移動平均を使用してストカスティック%D線を描きます.%K線が低位から%D線を突破すると,看板信号とみなされ,%K線が高位から%D線を突破すると,看板信号とみなされます.具体的入場および退出条件は以下のとおりです.
多頭入場:%K線が20以下のレベルから%D線を突破すると多頭入場 多頭退出:%Kラインが80以上のレベルから%Dラインを破るときに平仓 空頭入場:%K線が80以上のレベルから%D線を破るとき空頭 空頭退出:%K線が20以下から%D線を突破すると平仓
戦略的優位性
- ストカスティック指数を使用して,超買いと超売り領域を識別し,上位で多底空売りを避ける
- 指数パラメータの最適化と組み合わせて,取引信号の質を向上させる
- カスタマイズ可能な入場・退出条件,ポジション管理の最適化
- オプション取引で資金使用効率を向上させる
リスク分析
- ストキャスティック指標は偽信号を発生しやすいので,他の指標と組み合わせてフィルターする必要があります.
- 固定パラメータ設定では,いくつかの取引機会を逃す可能性があります.
- 撤収は拡大し,単一ポジションの規模をコントロールする必要がある
- 株の基本面とマクロ環境の変化に注目する
戦略最適化の方向性
- 移動平均などの指標で偽信号をフィルタリング
- 異なるパラメータの組み合わせをテストし,パラメータ設定を最適化
- 突破パラメータを増やして偽信号を減らす
- ストップ・ストップ条件の最適化,単発損失の制御
要約する
この戦略は,Stochastic指標の超買い超売り原理を使用して,潜在的な入場タイミングを識別する.従来のトレンド追跡戦略と比較して,市場転換点でより大きな市場を捕捉することができる.パラメータ最適化,シグナルフィルターなどの手段によって戦略の安定性をさらに向上させることができる.この戦略は,リスクを制御した前提で高い収益を勝ち取るために,オプション取引に使用することができる.
ストラテジーソースコード
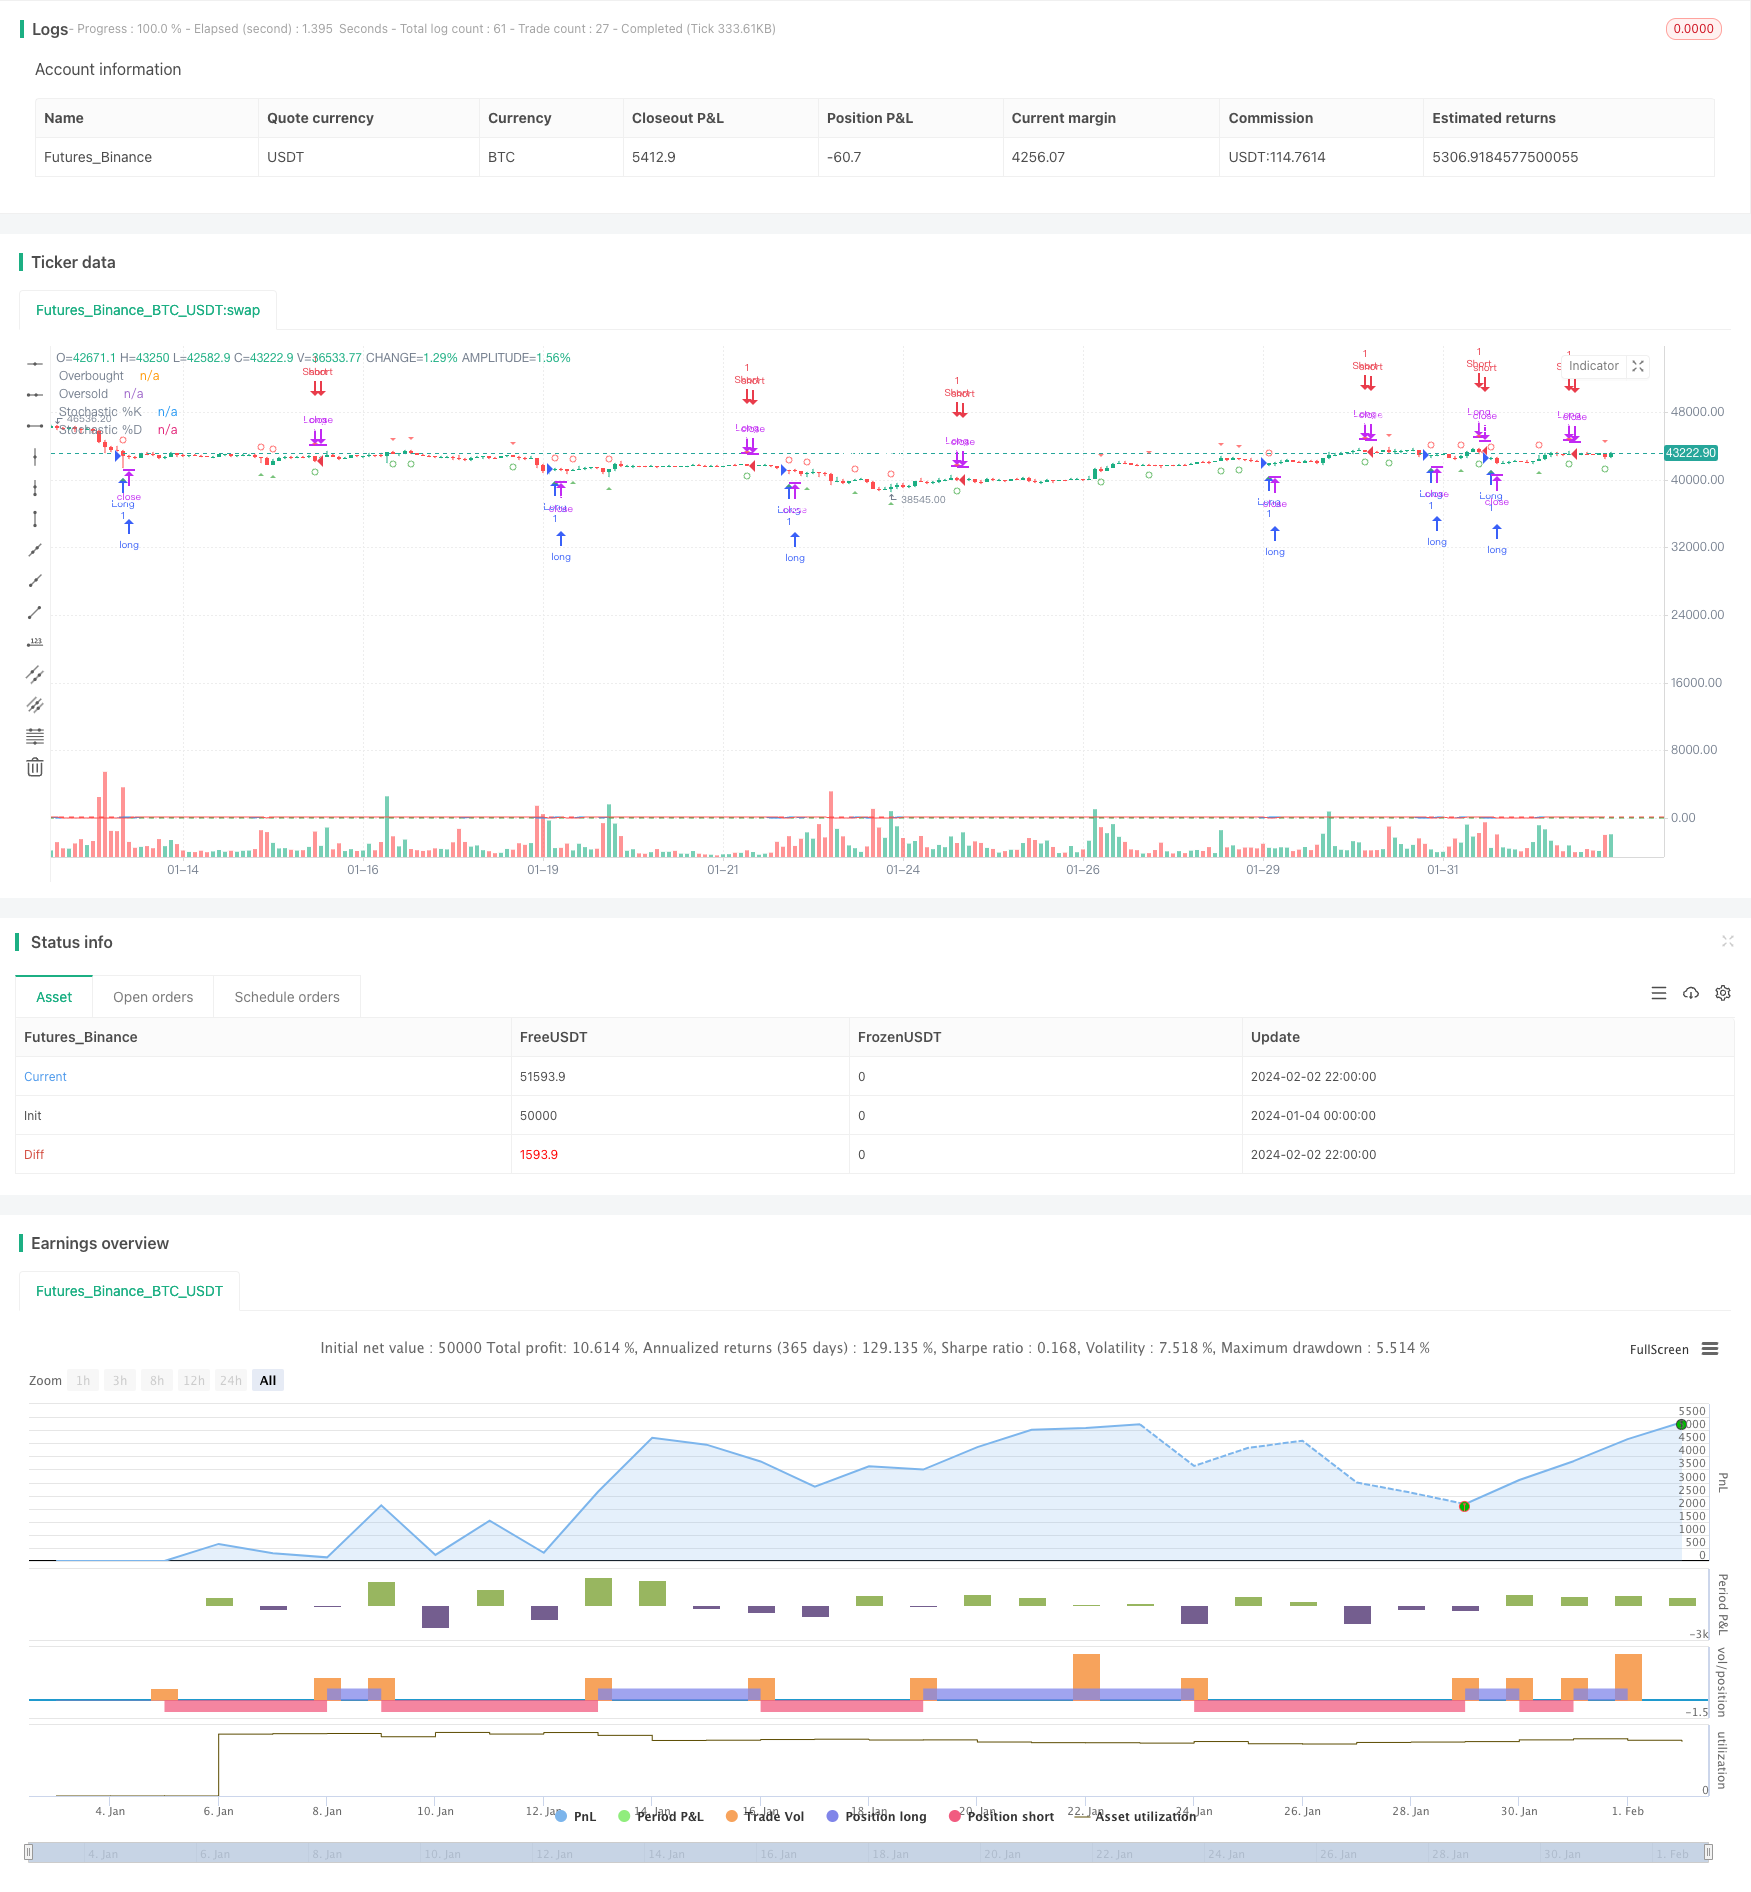
/*backtest
start: 2024-01-04 00:00:00
end: 2024-02-03 00:00:00
period: 2h
basePeriod: 15m
exchanges: [{"eid":"Futures_Binance","currency":"BTC_USDT"}]
*/

//@version=5
strategy("Stochastic Weekly Options Strategy", overlay=true, shorttitle="WOS")

// Stochastic settings
K = ta.stoch(close, high, low, 14)
D = ta.sma(K, 3)

// Entry and exit conditions
longEntry = ta.crossover(K, 20)
longExit = ta.crossunder(K, 80)

shortEntry = ta.crossunder(K, 80)
shortExit = ta.crossover(K, 20)

// Strategy execution
strategy.entry("Long", strategy.long, when=longEntry)
strategy.close("Long", when=longExit)

strategy.entry("Short", strategy.short, when=shortEntry)
strategy.close("Short", when=shortExit)

// Alert conditions
alertcondition(longEntry, title="Long Entry Alert", message="Stochastic bullish crossover! Consider buying a call option.")
alertcondition(longExit, title="Long Exit Alert", message="Stochastic bearish crossover! Consider selling the call option.")
alertcondition(shortEntry, title="Short Entry Alert", message="Stochastic bearish crossover! Consider buying a put option.")
alertcondition(shortExit, title="Short Exit Alert", message="Stochastic bullish crossover! Consider selling the put option.")

// Plotting shapes for buy and sell signals
plotshape(longEntry, title="Calls Entry Label", color=color.new(color.green, 25),
     textcolor=color.white, style=shape.triangleup, text="Calls", location=location.belowbar, size=size.small)

plotshape(longExit, title="Calls Exit Label", color=color.new(color.green, 25),
     textcolor=color.white, style=shape.circle, text="Exit", location=location.belowbar, size=size.small)

plotshape(shortEntry, title="Puts Entry Label", color=color.new(color.red, 25),
     textcolor=color.white, style=shape.triangledown, text="Puts", location=location.abovebar, size=size.small)

plotshape(shortExit, title="Puts Exit Label", color=color.new(color.red, 25),
     textcolor=color.white, style=shape.circle, text="Exit", location=location.abovebar, size=size.small)

// Plotting
plot(K, color=color.blue, title="Stochastic %K")
plot(D, color=color.red, title="Stochastic %D")
hline(80, "Overbought", color=color.red)
hline(20, "Oversold", color=color.green)