スーパートレンドモメンタムボラティリティデュアルインジケータータイミング戦略
作成日:
2024-02-04 15:53:48
最終変更日:
2024-02-04 15:53:48
コピー:
1
クリック数:
689
1
フォロー
1750
フォロワー
概要
この戦略は超トレンド指数とエリオット波理論を融合させ,堅固な技術的な取引ツールを構築しています. それは,多層のトレンド分析を使用して,より包括的な市場視点を提供し,市場における潜在的なトレンドの逆転と重要な価格変動を早期にキャプチャすることができます.
戦略原則
このプロジェクトでは,様々な分野を対象に研究を行っています.
- 4つの超トレンド指数を使用し,各指数は異なるATR長さと倍数を使用して,短期から長期のトレンドを判断します.
- 複数の指標を組み合わせることで, 安定した多空信号を特定できます.
- エリオット波のパターン認識方法を参照し,類似の市場行動パターンを識別し,取引信号を確認する
複数の指標を活用するとともに,パターン認識も加えられ,戦略がより堅牢になります.
優位分析
- マルチ指標デザインで全面的な判断
- 波の理論に触発され,パターンの認識により安定性が向上します.
- リアルタイムで方向転換し,市場の変化に対応する
- パラメータは,異なる品種と時間周期に適用して構成できます
リスク分析
- パラメータ設定は経験に依存し,最適なパラメータ組み合わせを決定するために調整する必要があります.
- 多指標設計は複雑で,計算負荷が増加する
- 誤信号の発生を完全に回避できない
パラメータ最適化により,最適のパラメータを段階的に決定することができる. コンピューティング性能を向上させるためのクラウドコンピューティングを採用し,リスクを制御するためのストップダスの設定を行うことができる.
最適化の方向
ウェブのコンテンツを編集する際には,
- 市場状況に応じて動的にパラメータを調整するモジュールを追加
- 取引信号の信頼性を判断する機械学習モデルを追加
- 感情指標やニュースイベントなどの外部要因を組み合わせて市場パターンを判断する
- 多種パラメータのテンプレートをサポートし,テストの作業量を減らす
戦略のパラメータがより賢く,判断がより正確で,実用化がより容易になる.
要約する
この戦略総合は,傾向とモデルの2つの次元を考慮し,判断の安定性を保証するとともに,戦略の柔軟性を高めます.複数の指標とパラメータの設定は,市場全体の適用性を保証します. 賢明化,自動化の方法がさらに導入されれば,戦略の実戦レベルが大きく向上します. それは,技術取引の発展に有益なインスピレーションと借用を提供します.
ストラテジーソースコード
/*backtest
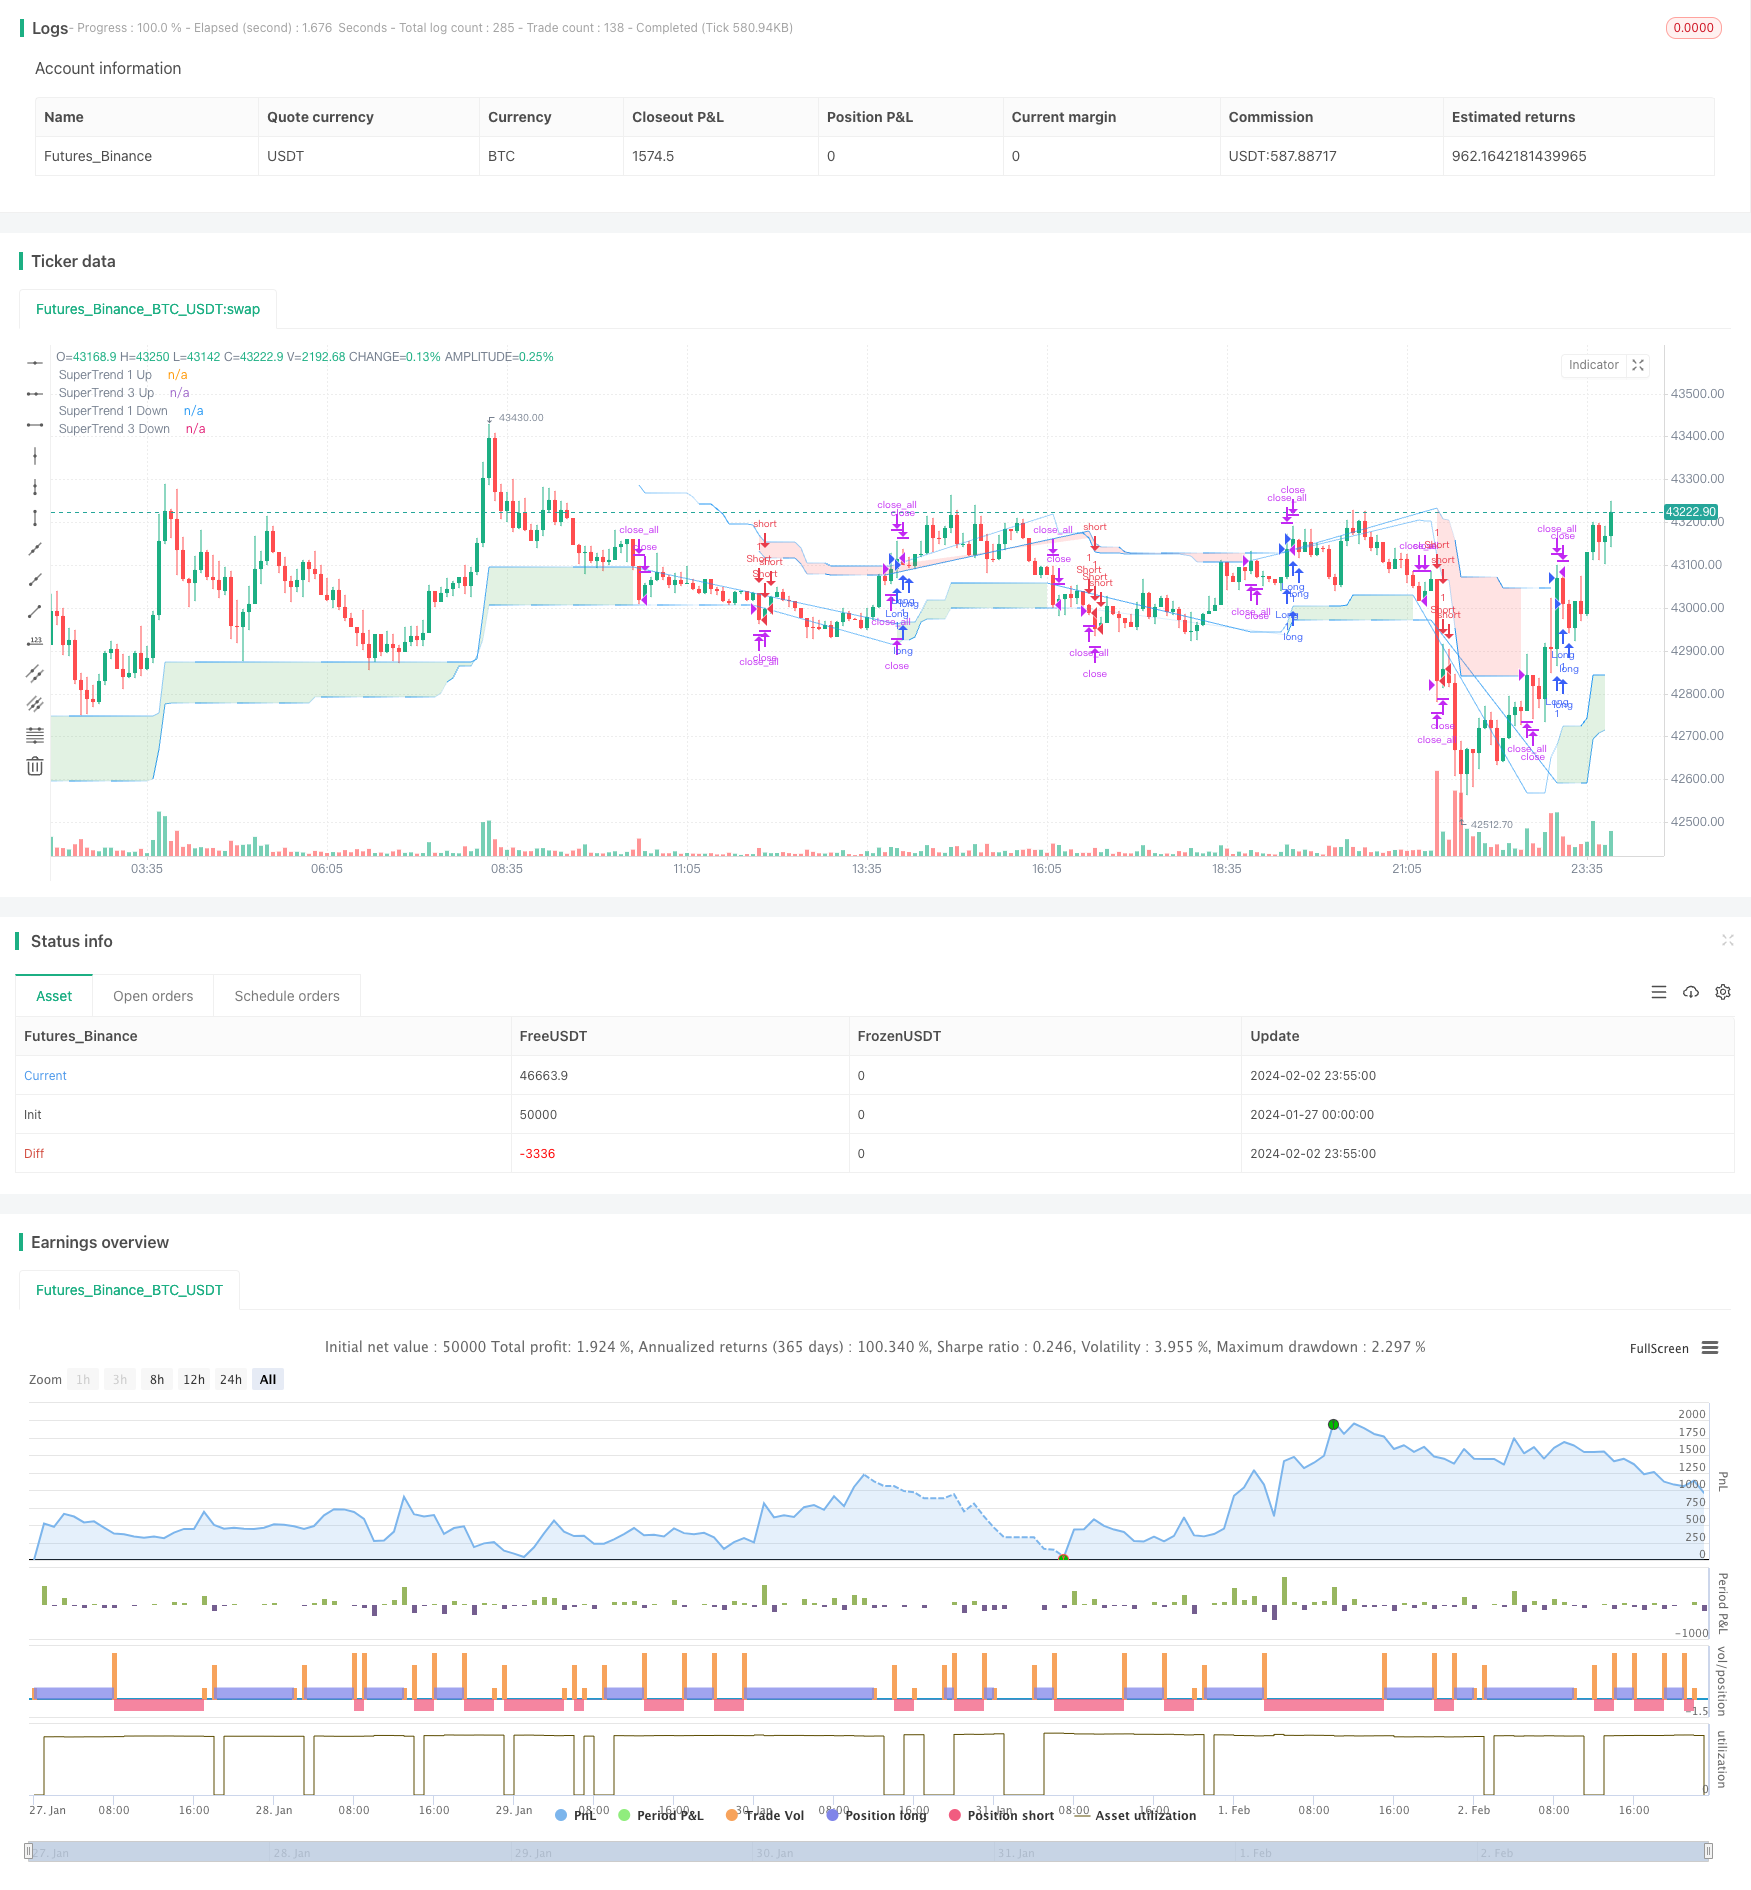
start: 2024-01-27 00:00:00
end: 2024-02-03 00:00:00
period: 5m
basePeriod: 1m
exchanges: [{"eid":"Futures_Binance","currency":"BTC_USDT"}]
*/
//@version=5
strategy("Elliott's Quadratic Momentum - Strategy [presentTrading]",shorttitle = "EQM Strategy [presentTrading]", overlay=true )
// Inputs for selecting trading direction
tradingDirection = input.string("Both", "Select Trading Direction", options=["Long", "Short", "Both"])
// SuperTrend Function
supertrend(src, atrLength, multiplier) =>
atr = ta.atr(atrLength)
up = hl2 - (multiplier * atr)
dn = hl2 + (multiplier * atr)
trend = 1
trend := nz(trend[1], 1)
up := src > nz(up[1], 0) and src[1] > nz(up[1], 0) ? math.max(up, nz(up[1], 0)) : up
dn := src < nz(dn[1], 0) and src[1] < nz(dn[1], 0) ? math.min(dn, nz(dn[1], 0)) : dn
trend := src > nz(dn[1], 0) ? 1 : src < nz(up[1], 0)? -1 : nz(trend[1], 1)
[up, dn, trend]
// Inputs for SuperTrend settings
atrLength1 = input(7, title="ATR Length for SuperTrend 1")
multiplier1 = input(4.0, title="Multiplier for SuperTrend 1")
atrLength2 = input(14, title="ATR Length for SuperTrend 2")
multiplier2 = input(3.618, title="Multiplier for SuperTrend 2")
atrLength3 = input(21, title="ATR Length for SuperTrend 3")
multiplier3 = input(3.5, title="Multiplier for SuperTrend 3")
atrLength4 = input(28, title="ATR Length for SuperTrend 3")
multiplier4 = input(3.382, title="Multiplier for SuperTrend 3")
// Calculate SuperTrend
[up1, dn1, trend1] = supertrend(close, atrLength1, multiplier1)
[up2, dn2, trend2] = supertrend(close, atrLength2, multiplier2)
[up3, dn3, trend3] = supertrend(close, atrLength3, multiplier3)
[up4, dn4, trend4] = supertrend(close, atrLength4, multiplier4)
// Entry Conditions based on SuperTrend and Elliott Wave-like patterns
longCondition = trend1 == 1 and trend2 == 1 and trend3 == 1 and trend4 == 1
shortCondition = trend1 == -1 and trend2 == -1 and trend3 == -1 and trend4 == - 1
// Strategy Entry logic based on selected trading direction
if tradingDirection == "Long" or tradingDirection == "Both"
if longCondition
strategy.entry("Long", strategy.long)
// [Any additional logic for long entry]
if tradingDirection == "Short" or tradingDirection == "Both"
if shortCondition
strategy.entry("Short", strategy.short)
// [Any additional logic for short entry]
// Exit conditions - Define your own exit strategy
// Example: Exit when any SuperTrend flips
if trend1 != trend1[1] or trend2 != trend2[1] or trend3 != trend3[1] or trend4 != trend4[1]
strategy.close_all()
// Function to apply gradient effect
gradientColor(baseColor, length, currentBar) =>
var color res = color.new(baseColor, 100)
if currentBar <= length
res := color.new(baseColor, int(100 * currentBar / length))
res
// Apply gradient effect
color1 = gradientColor(color.blue, atrLength1, bar_index % atrLength1)
color4 = gradientColor(color.blue, atrLength4, bar_index % atrLength3)
// Plot SuperTrend with gradient for upward trend
plot1Up = plot(trend1 == 1 ? up1 : na, color=color1, linewidth=1, title="SuperTrend 1 Up")
plot4Up = plot(trend4 == 1 ? up4 : na, color=color4, linewidth=1, title="SuperTrend 3 Up")
// Plot SuperTrend with gradient for downward trend
plot1Down = plot(trend1 == -1 ? dn1 : na, color=color1, linewidth=1, title="SuperTrend 1 Down")
plot4Down = plot(trend4 == -1 ? dn4 : na, color=color4, linewidth=1, title="SuperTrend 3 Down")
// Filling the area between the first and third SuperTrend lines for upward trend
fill(plot1Up, plot4Up, color=color.new(color.green, 80), title="SuperTrend Upward Band")
// Filling the area between the first and third SuperTrend lines for downward trend
fill(plot1Down, plot4Down, color=color.new(color.red, 80), title="SuperTrend Downward Band")