移動平均クロスオーバートレンドフォロー戦略
作成日:
2024-02-05 14:12:27
最終変更日:
2024-02-05 14:12:27
コピー:
1
クリック数:
600
1
フォロー
1664
フォロワー

概要
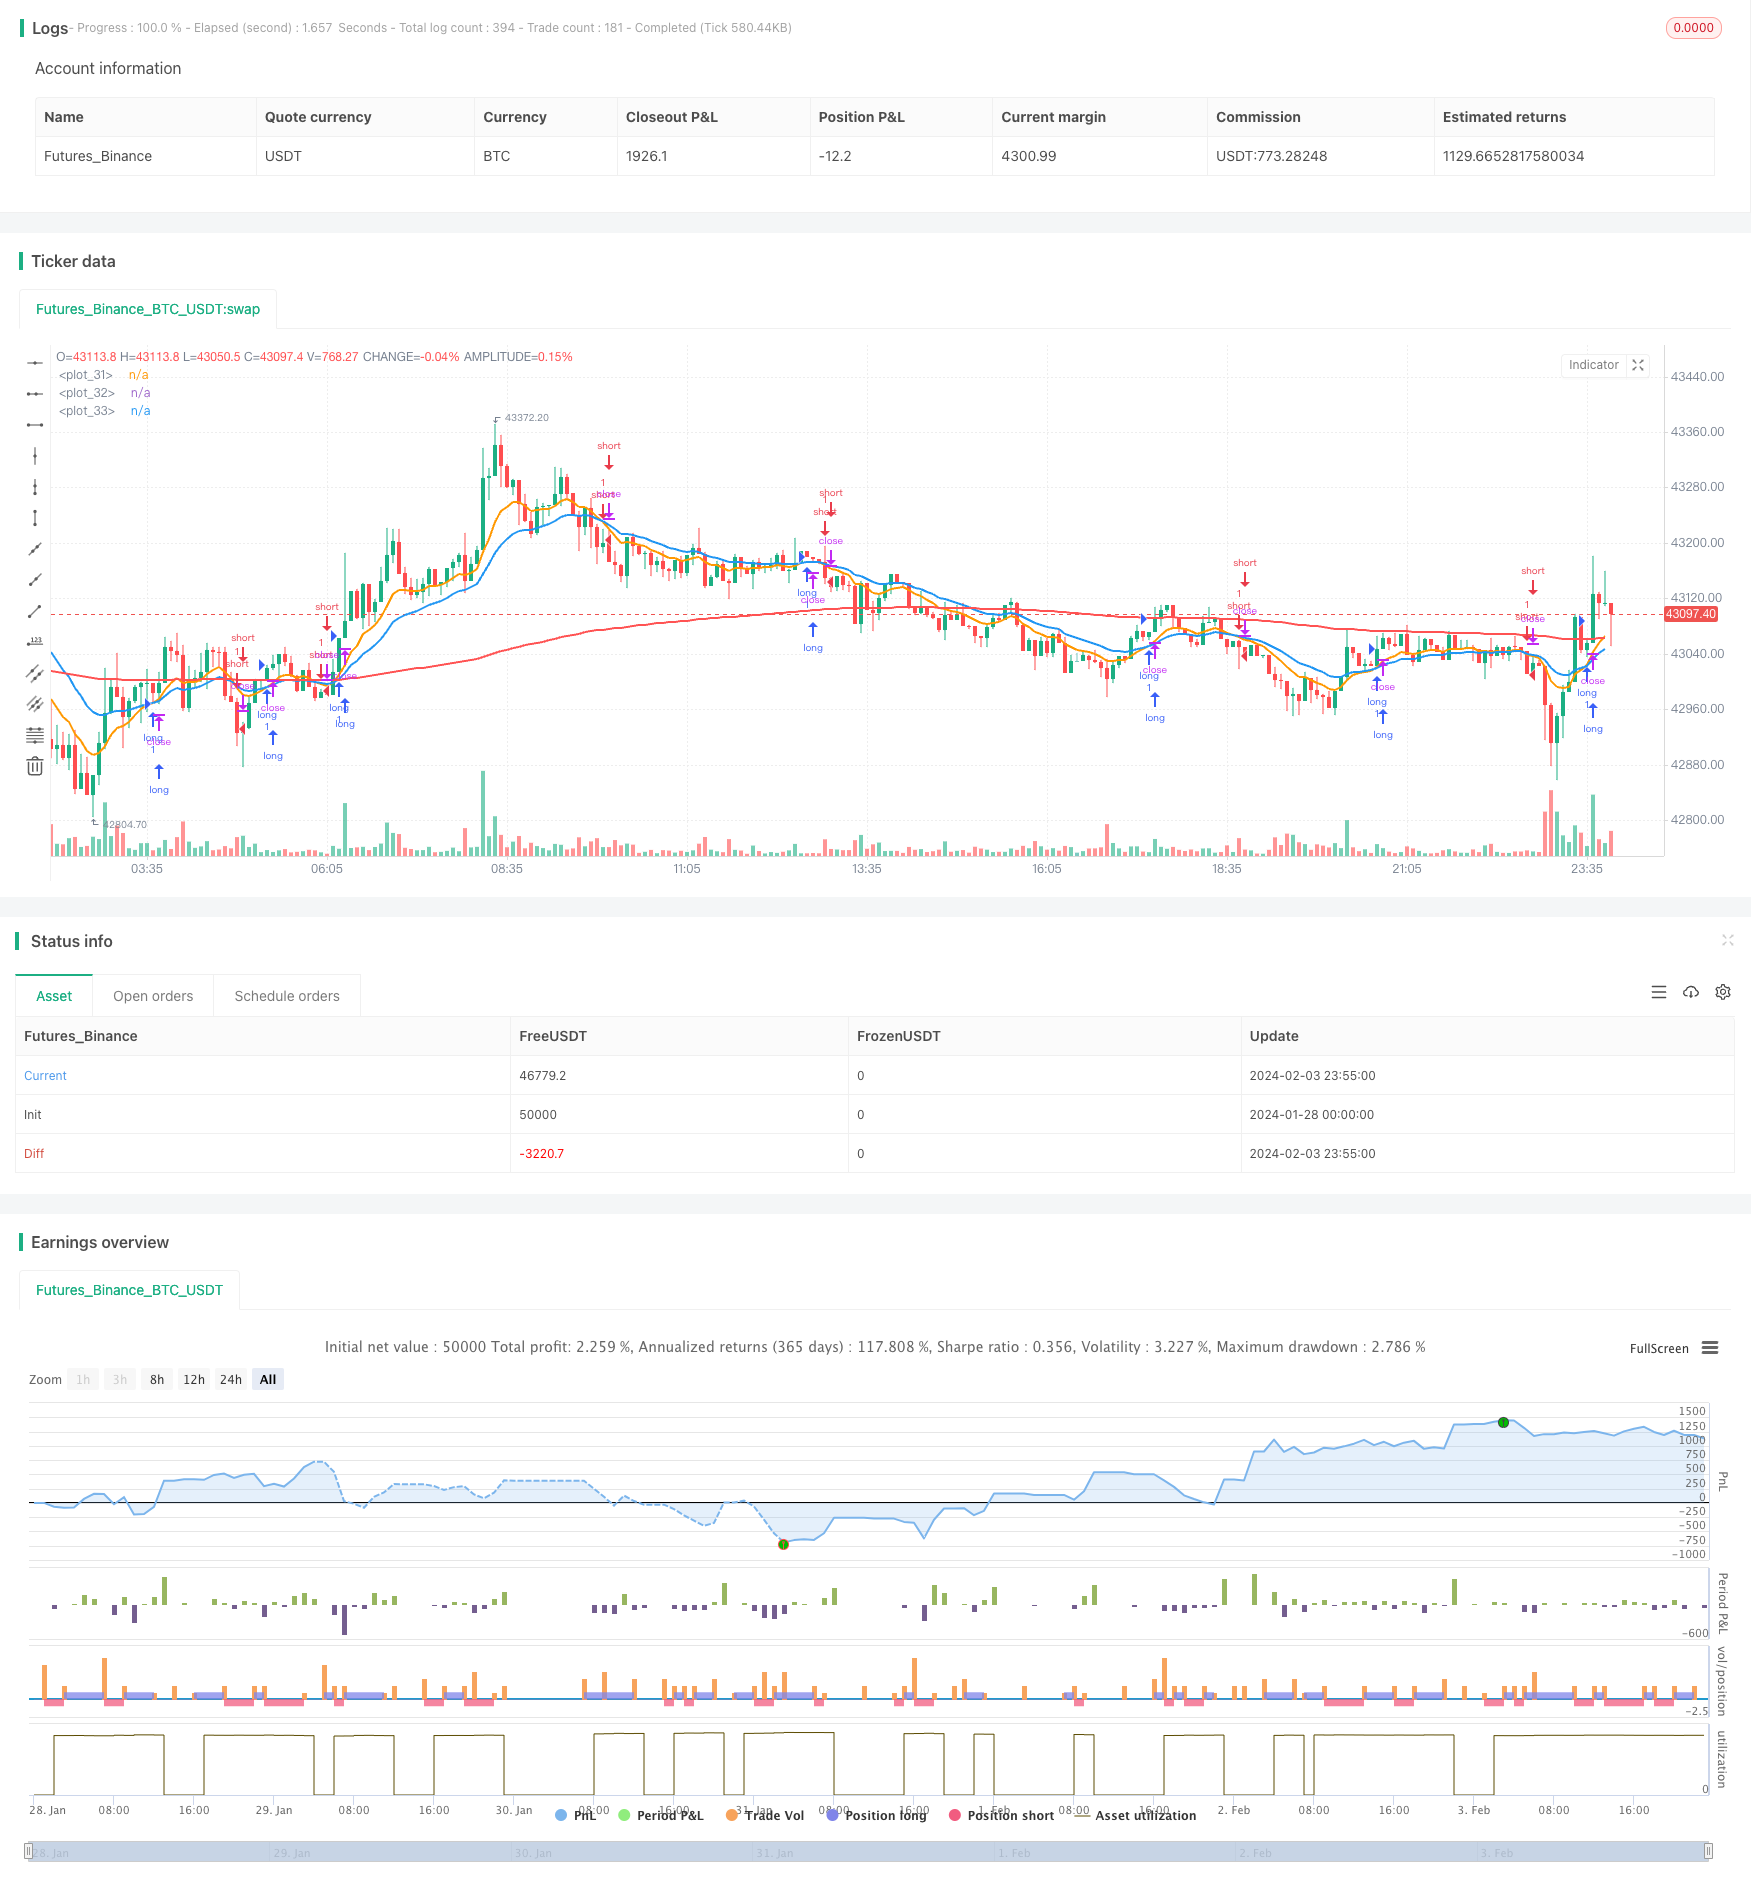
移動平均線交差トレンド追跡戦略は,市場トレンドを追跡する量化取引戦略である.この戦略は,急速移動平均線と遅い移動平均線を計算し,それらの交差が起こる時に取引信号を生成して,市場トレンドの転換点を捕捉する.
戦略原則
この戦略の核心原則は,異なるパラメータの指数移動平均線 ((EMA) を使って市場傾向の判断を実現することです.戦略では,急速なEMAと遅いEMAを定義しています. 急速なEMAが下からゆっくりとしたEMAを横切るときは,市場傾向が転がり,急速なEMAが上からゆっくりとしたEMAを横切るときは,市場傾向が転がり,市場傾向が転がり,市場傾向が転がりしていることを示しています.
上着すると多枚,下着すると空券となります. ストップ・ストップ・損失が触発されるか,また交差反転が起こるまで,戦略はポジションを保持します.
優位分析
この戦略の利点は以下の通りです.
- 戦略の論理はシンプルでわかりやすく,理解しやすく,初心者のためのものです.
- EMAの平準化により,市場ノイズを効率的にフィルターし,トレンドを特定できます.
- 市場が変化する周期に合わせて,パラメータを柔軟に調整できる.
- 戦略を複数の時間周期のバージョンに拡張して,安定性を向上させることができます.
リスク分析
この戦略にはいくつかのリスクがあります.
- 震災の時には,複数のストップダストが起こり,利益に影響を及ぼします.
- 傾向の種類を効果的に識別できない (牛,熊) で,大きな損失を招く可能性があります.
- EMAパラメータの設定が不適切で,取引頻度が高くなり,認識が遅れる可能性があります.
リスクを下げるために,他の指標と組み合わせてトレンドの種類を判断するか,あるいは,ストップ・ロスの割合を緩やかに設定することを考えることができます.
最適化の方向
この戦略は,以下の点で最適化できます.
- 逆のポジションを避けるため,トレンドの種類を判断する能力を高めること.
- 複数の時間周期で判断し,信号の質を向上させる.
- ストップ・ダメージ・ストップの比率を動的に調整し,出口を最適化します.
- 他の指標のフィルタリング信号と組み合わせて,誤差取引を減らす.
要約する
移動均線交差トレンド追跡戦略は,全体としてシンプルで実用的なトレンド取引戦略である.この戦略の核心思想は明確で,実践しやすいが,同時に,ある程度の最適化余地もある.パラメータ調整,多周期判断,動的停止などによって,戦略の安定性と収益性のレベルを継続的に向上させることができる.
ストラテジーソースコード
/*backtest
start: 2024-01-28 00:00:00
end: 2024-02-04 00:00:00
period: 5m
basePeriod: 1m
exchanges: [{"eid":"Futures_Binance","currency":"BTC_USDT"}]
*/

//@version=5
strategy('Zhukov trade', overlay=true, calc_on_every_tick=true, currency=currency.USD)

// INPUT:

// Options to enter fast and slow Exponential Moving Average (EMA) values
emaFast = input.int(title='Fast EMA', defval=10, minval=1, maxval=9999)
emaSlow = input.int(title='Slow EMA', defval=20, minval=1, maxval=9999)

// Option to select trade directions
tradeDirection = input.string(title='Trade Direction', options=['Long', 'Short', 'Both'], defval='Both')

// Options that configure the backtest date range
startDate = input(title='Start Date', defval=timestamp('01 Jan 2023 00:00'))
endDate = input(title='End Date', defval=timestamp('31 Dec 2030 23:59'))

// Set take profit and stop loss percentages
take_profit_percent = input(1.0, title ="Take Profit Percent") / 100.0
stop_loss_percent = input(1.0, title ="Stop Loss Percent") / 100.0

// CALCULATIONS:

// Use the built-in function to calculate two EMA lines
fastEMA = ta.ema(close, emaFast)
slowEMA = ta.ema(close, emaSlow)
emapos = ta.ema(close, 200)

// PLOT:

// Draw the EMA lines on the chart
plot(series=fastEMA, color=color.new(color.orange, 0), linewidth=2)
plot(series=slowEMA, color=color.new(color.blue, 0), linewidth=2)
plot(series=emapos, color=color.new(color.red, 0), linewidth=2)

// CONDITIONS:

// Check if the close time of the current bar falls inside the date range
inDateRange = true

// Translate input into trading conditions
longOK = tradeDirection == 'Long' or tradeDirection == 'Both'
shortOK = tradeDirection == 'Short' or tradeDirection == 'Both'

// Decide if we should go long or short using the built-in functions
longCondition = ta.crossover(fastEMA, slowEMA) and inDateRange
shortCondition = ta.crossunder(fastEMA, slowEMA) and inDateRange

// ORDERS:

// Submit entry (or reverse) orders
if longCondition and longOK
    strategy.entry(id='long', direction=strategy.long)

if shortCondition and shortOK
    strategy.entry(id='short', direction=strategy.short)

// Exit orders
if strategy.position_size > 0 and longOK
    strategy.exit(id='exit long', from_entry='long', limit=strategy.position_avg_price * (1 + take_profit_percent), stop=strategy.position_avg_price * (1 - stop_loss_percent))

if strategy.position_size < 0 and shortOK
    strategy.exit(id='exit short', from_entry='short', limit=strategy.position_avg_price * (1 - take_profit_percent), stop=strategy.position_avg_price * (1 + stop_loss_percent))