トレンドフォローストップロス戦略

概要
トレンドトラッキングストップ戦略は,トレンド指数TrendAlertに基づくストップトラッキング取引戦略である. トレンドAlert指数によってトレンドの方向性を判断し,トレンドトラッキング入場を実現する. 同時に,ATR指数を使用してストップロスを設定し,リスク管理を実現する.
戦略原則
この戦略は以下の部分から構成されています.
-
トレンドアラート指数は,トレンドの方向を判断する. トレンドアラートが0より大きい時は看板信号,0より小さい時は下落信号である.
-
ATR指数は,近期価格変動の範囲を計算する.ATRはATRのストップ・プローパーをatrStopMultiplierで固定したストップ・ポイントとして掛けます.
-
最低価格lowestLowと最高価格highestHighを組み合わせてATRストップはストップ追跡を構築する.structureパラメータの制御が有効であるかどうか.
-
トレンドシグナル方向に応じて,多引または短引のポジションに入ります. 入場後,テイクプロフィットとストップロスを設定します.
-
価格がストップ・ロースまたはストップ・ストップを触発した後の平仓.
この戦略は,トレンドを判断し,偽信号をフィルターし,ストップ・ローズ・コントロール・リスクを追跡し,収益性を確保し,取引システムの安定性を全般的に向上させるというものです.
優位分析
この戦略の利点は以下の通りです.
-
トレンドフィルタリングとストップ・ロスの追跡は,市場騒音を追いかけるのを避けるための二重保証であり,取引リスクを制御できるようにします.
-
ATRは,多種多様な市場環境に適用される過度最適化防止のための自主的な止損設定である.
-
目標のストップは,利益を確保し,利益を食い尽くさないようにすることです.
-
戦略の論理は明快で簡潔で,修正は容易に理解でき,量化トレーダーの二次開発に適しています.
-
Pineスクリプト言語で書かれ,TradingViewプラットフォームで直接使用できます.プログラミングの基礎は不要です.
リスク分析
この戦略にはいくつかのリスクがあります.
-
トレンド判断の誤りにより,不必要な入場とストップがトリガーされる可能性がある.適切なストップ・ロスを緩め,入場信号をフィルターすることができる.
-
状況が激しく波動すると,ATRは実際の波幅を過小評価する可能性がある.この場合,ATRのストップ損失倍数atrStopMultiplierを増加させることができる.
-
ターゲットストップは,戦略の利益の余地を制限する可能性がある.市場によるlimitMultiplierパラメータの調整が可能である.
-
コード・エクスティストの論理は価格のみに基づいているが,実際には時間管理と組み合わせるべきである.
最適化の方向
この戦略は以下の点で最適化できます.
-
パラメータを最適化してATR長さatrLengthと止損倍数atrStopMultiplierを設定し,止損アルゴリズムの感度を調整する.
-
異なるトレンドの指標を試し,よりよい入学タイミングを探してください.
-
特定の取引品種の特徴に応じてターゲットストップパラメータを選択または調整する.
-
時間の損失を防ぐ仕組みを導入し,一人泊りのリスクを回避する.
-
取引量指標のフィルターで偽の突破を組み合わせた戦略の安定性を向上させる.
要約する
この戦略は全体的に非常に実用的なトレンド追跡ストップ・ストップ戦略である.指標を用い,トレンドの方向性を判断し,トレンド追跡を実現し,同時に自己適応ストップを設定し,リスクコントロールを確保する.この戦略は論理的に明確で,使いやすい.初心者の学習に最適である.また,高度な戦略開発に優れた取引戦略の枠組みを提供している.量化トレーダーが深入に研究し,最適化する価値がある.
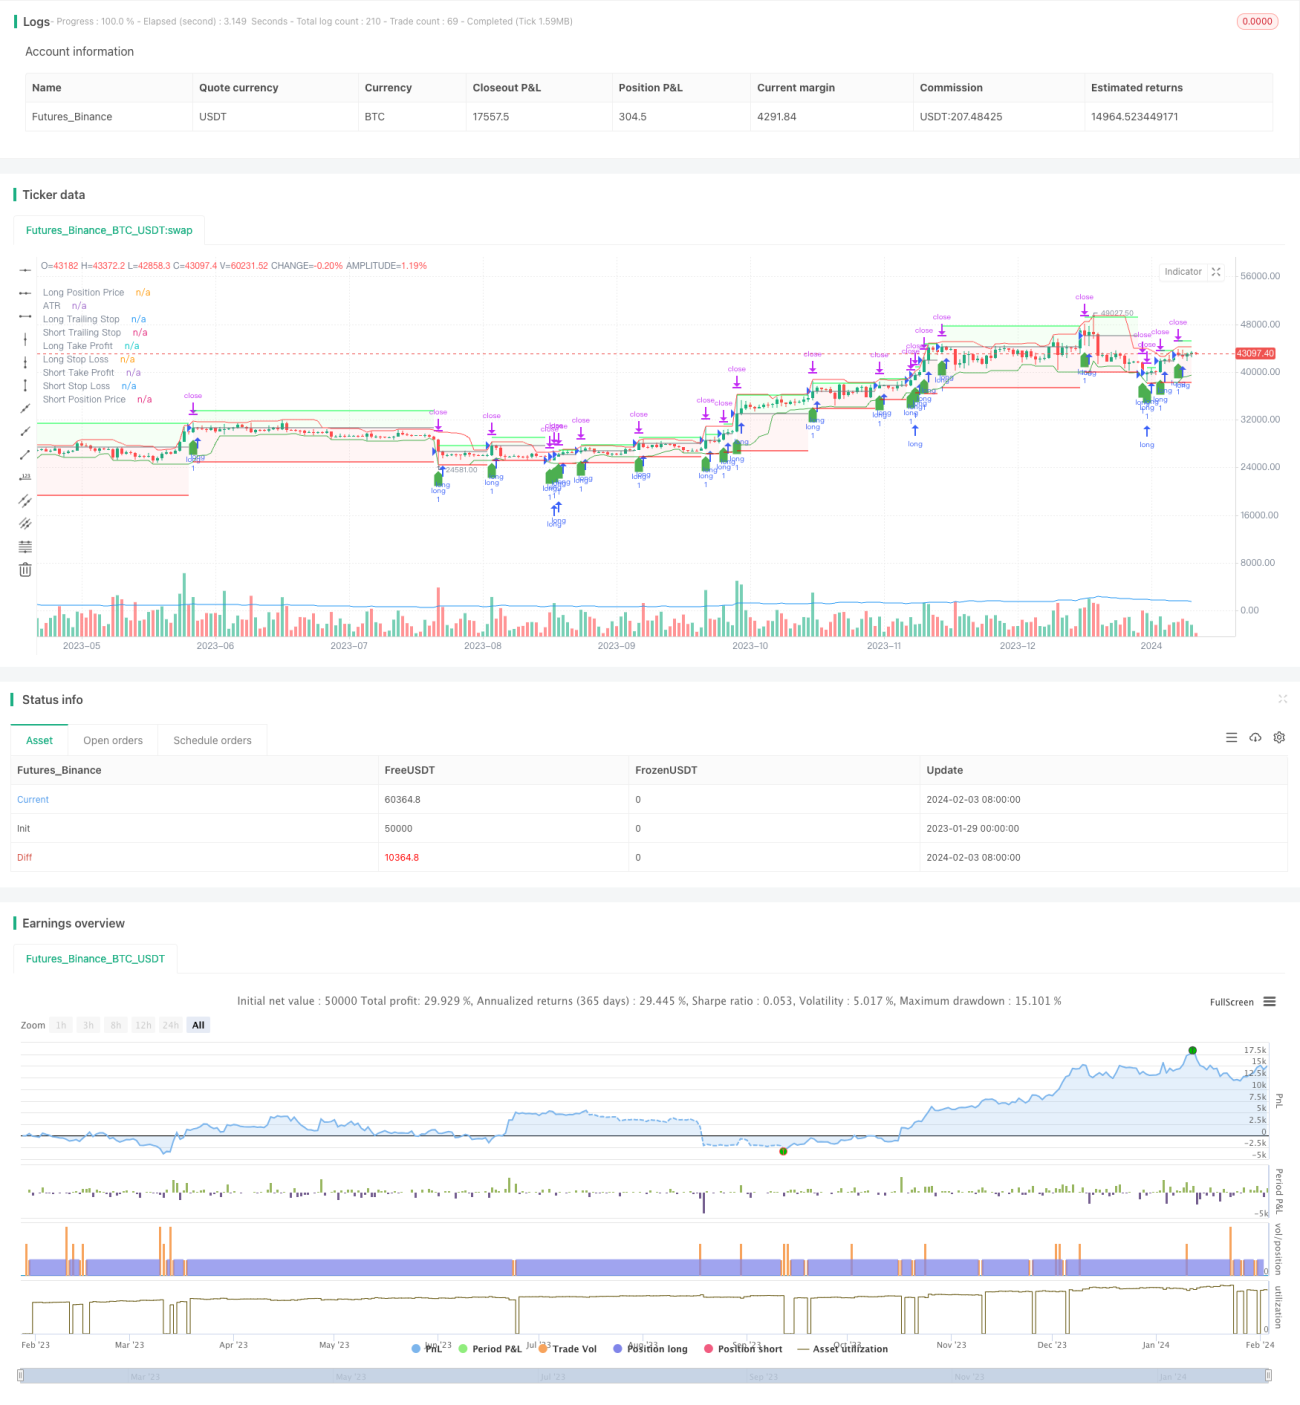
/*backtest
start: 2023-01-29 00:00:00
end: 2024-02-04 00:00:00
period: 1d
basePeriod: 1h
exchanges: [{"eid":"Futures_Binance","currency":"BTC_USDT"}]
*/

// This Pine Script™ code is subject to the terms of the Mozilla Public License 2.0 at https://mozilla.org/MPL/2.0/
// © jaque_verdatre

//@version=5- 1