マルチインジケーターテクニカル定量取引戦略
作成日:
2024-02-21 11:53:30
最終変更日:
2024-02-21 11:53:30
コピー:
2
クリック数:
966
1
フォロー
1750
フォロワー
概要
この戦略は,パラグラフ・ライン・タービング・システム,世論・エクスポート,ゼロ・ラグのシンプル・ムービング・アベアンス,インデックス・ムービング・アベアンス,表向き均等線など,複数の技術指標を統合して,チャート上の潜在的な買出点を識別する.
戦略原則
主な指標
- パラパラダイム回転システム: ストップポイントと潜在的なエントリーポイントを特定する
- 輸出戦略:トレンドを決定する
- ゼロ遅滞のシンプル移動平均:低遅滞の移動平均を提供
- 指数移動平均:価格の動向と変動を追跡する
- スムーズな平均線:よりスムーズな平均線を生成する
取引信号
- パラグラフ回転システムは,上昇傾向を示し,価格が第99項指数移動平均を超えると,多めにします. 減少傾向を示し,価格が第99項指数移動平均を下回ると,空白します.
- 輸出戦略と世論の合図により,トレンドの方向性がさらに確認される
- 滑らかな均等な線はパラパラ線信号と連携し,偽突破を避ける
リスク管理
- ストップとストップを設定します.
- 買い替え条件を考慮し,ポジションを柔軟に調整する
優位分析
この戦略の最大の利点は,指標の組み合わせが包括的で,トレンドの方向を効果的に識別できるという点にある.対極線システムは,潜在的逆転点を特定する.意見の輸出戦略は,主要なトレンドを判断する.移動平均は,偽信号をフィルターする.複数の指標は,相互に検証し,信号の正確性を大幅に向上する.
また,戦略にはリスク管理のための止損と停止のメカニズムが加えられている.平滑な均等線は,短期的な騒音の干渉を避けるためにも使用されている.これらは,戦略の安定性を強めている.
リスク分析
指標判断が多すぎるため,これらの指標が衝突信号を発したときに,この戦略は一定の困難に直面する.また,パラメータの設定が不適切であることも取引に悪影響を与える.
また,技術面での取引は,それ自体にはある程度のリスクがあり,損失を完全に回避することはできません.
最適化の方向
- テストと最適化のための指標パラメータ
- 信号の精度をさらに高めるために,ビッグデータ訓練モデルを利用した機械学習アルゴリズムを組み込む.
- 市場状況を判断し,ポジションとストップラインを動的に調整します.
- 購入条件のリセットロジックを最適化して,シグナル検出をより柔軟かつ一貫性のあるものにします.
要約する
この戦略は,複数の技術指標を統合し,指標の組み合わせによって取引信号を識別する. 信号の精度が高く,安定性が高い. 同時に,リスク管理の措置が設けられている. 全体的に見ると,検討に値する取引方案である. 後々,パラメータ最適化,モデルトレーニング,感情指標の導入などの手段によってさらに完善することができる.
ストラテジーソースコード
/*backtest
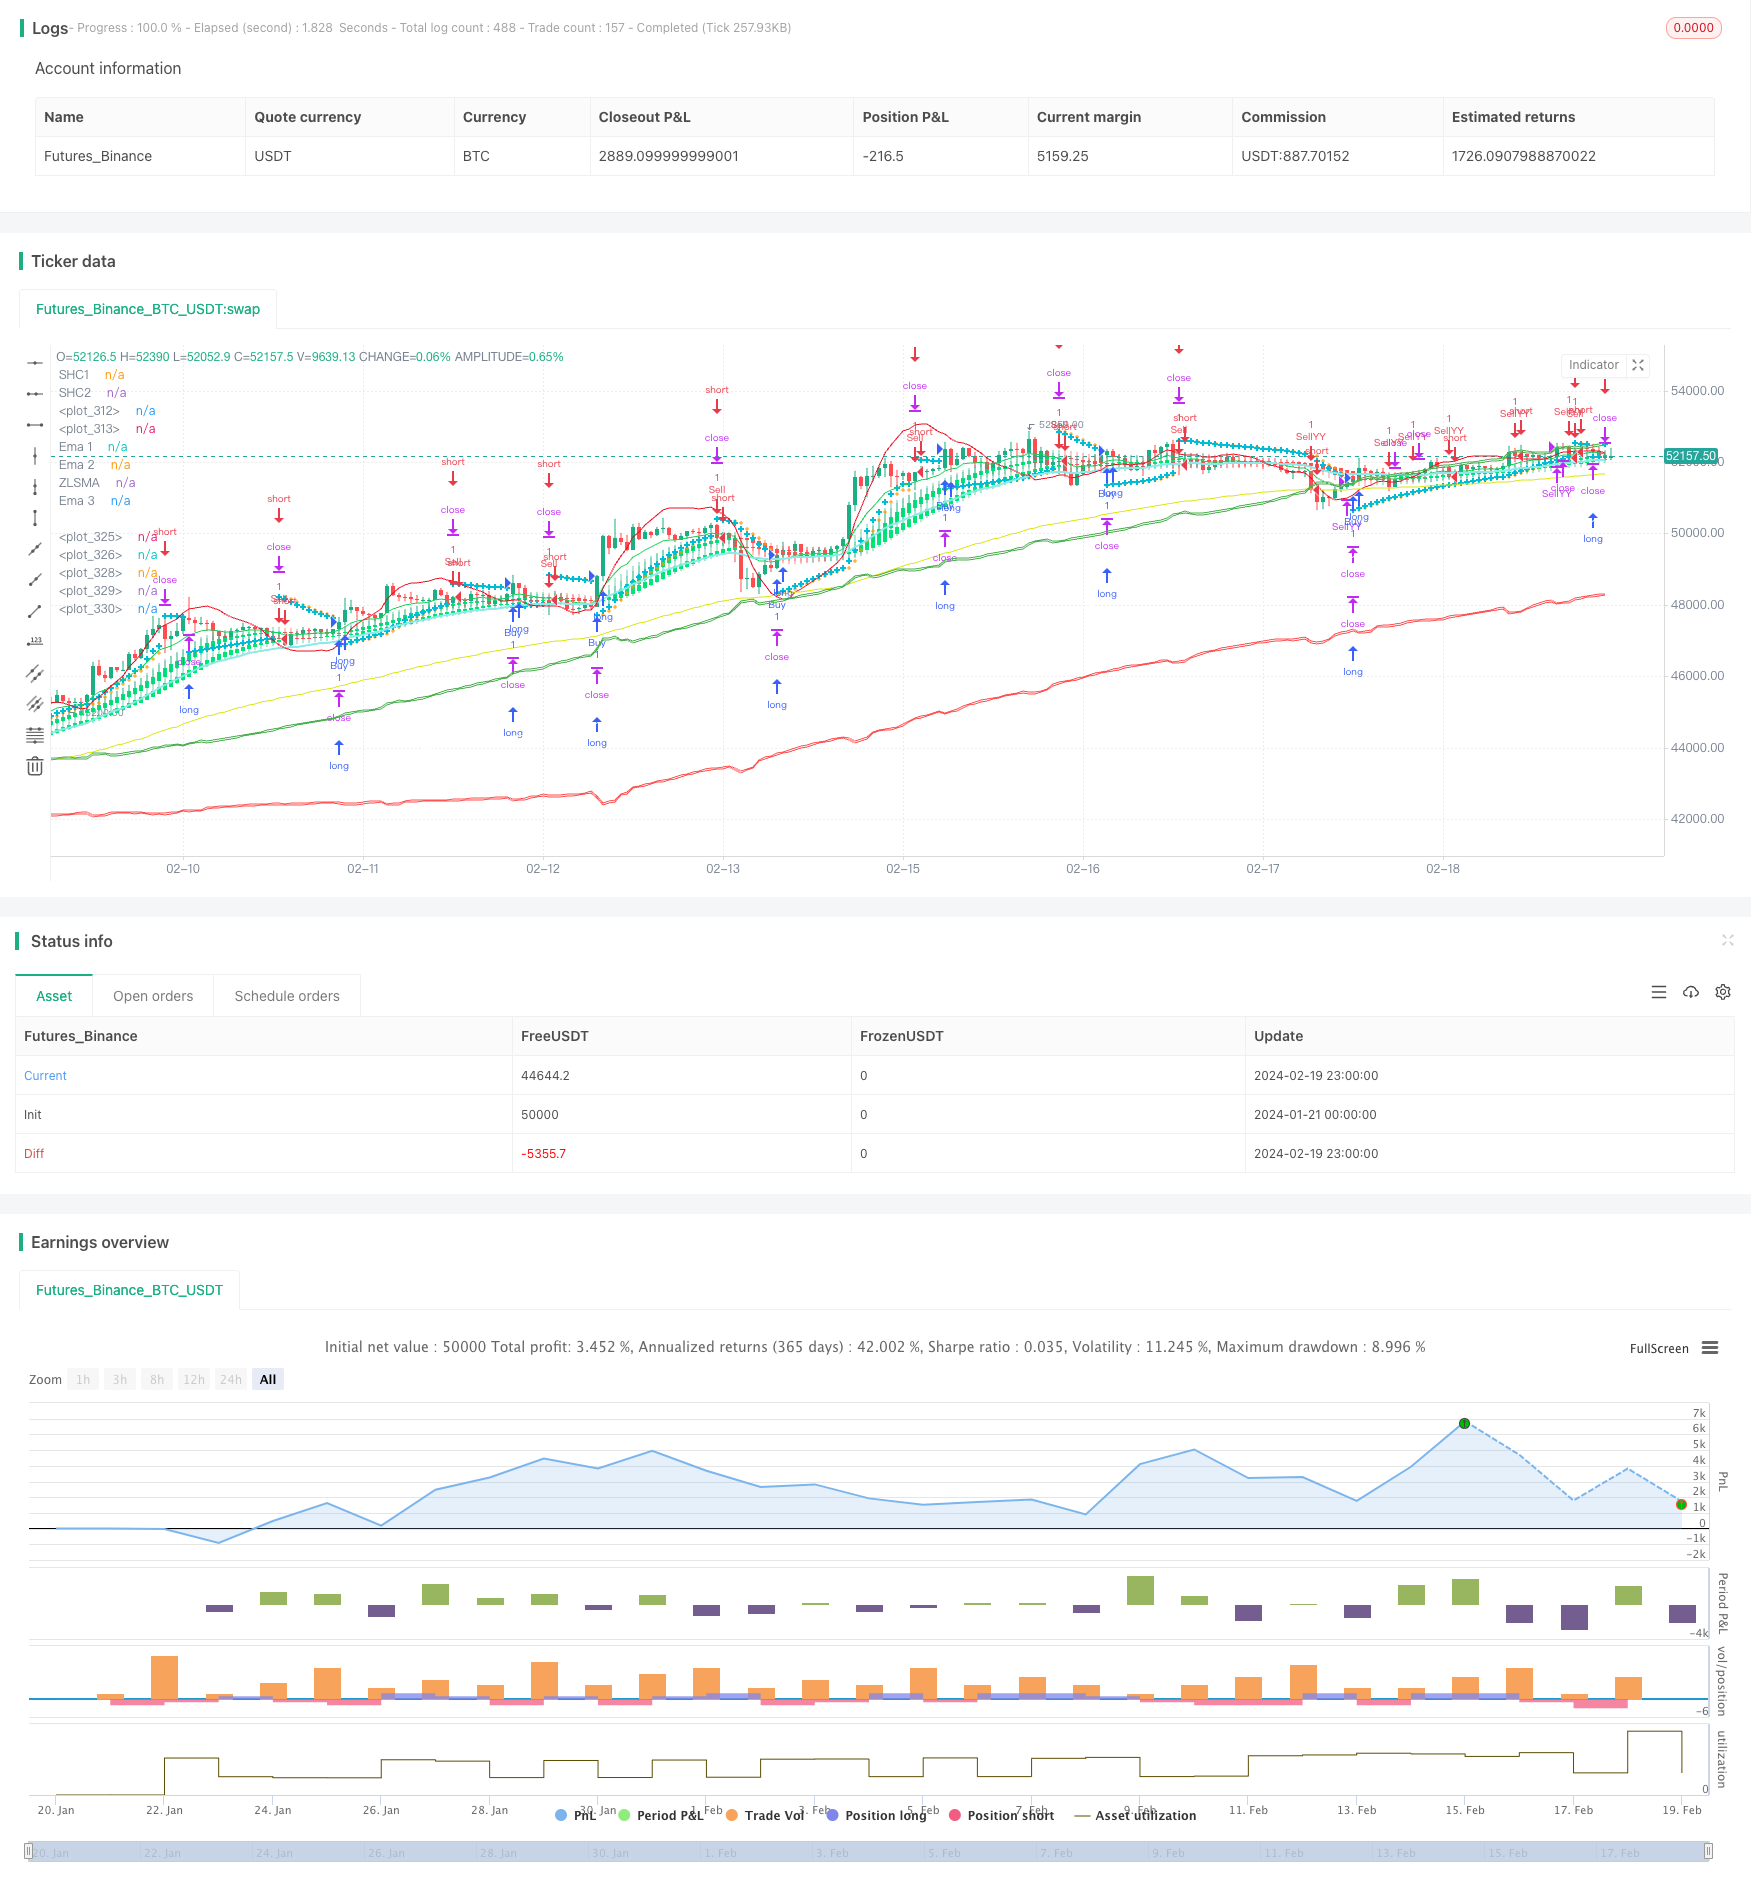
start: 2024-01-21 00:00:00
end: 2024-02-20 00:00:00
period: 1h
basePeriod: 15m
exchanges: [{"eid":"Futures_Binance","currency":"BTC_USDT"}]
*/
//@version=5
strategy("CE-ZLSMA-EMA-SAR-SHC", overlay=true)
// Parabolic SAR Strategy
start = input(0.02)
increment = input(0.02)
maximum = input(0.2)
var bool uptrend = na
var float EP = na
var float SAR = na
var float AF = start
var float nextBarSAR = na
var bool longSar = false
var bool shortSar = false
//input smoothed HAC 1
len=input.int(title="Length SHC1", defval = 10)
o=ta.ema(open,len)
c=ta.ema(close,len)
h=ta.ema(high,len)
l=ta.ema(low,len)
haclose = (o+h+l+c)/4
var haopen = 0.0
if na(haopen[1])
haopen := (o + c) / 2
else
haopen := (haopen[1] + haclose[1]) / 2
hahigh = math.max (h, math.max(haopen,haclose))
halow = math.min (l, math.min(haopen,haclose))
len2=input(10)
o2=ta.ema(haopen, len2)
c2=ta.ema(haclose, len2)
h2=ta.ema(hahigh, len2)
l2=ta.ema(halow, len2)
col=o2>c2 ? color.red : color.lime
bool shc1Green = o2 > c2
bool shc1Lime = o2 < c2
//input smoothed HAC 1
lenSHC2=input.int(title="Length SHC2 ", defval = 20)
oShc2=ta.ema(open,lenSHC2)
cShc2=ta.ema(close,lenSHC2)
hShc2=ta.ema(high,lenSHC2)
lShc2=ta.ema(low,lenSHC2)
hacloseShc2 = (oShc2+hShc2+lShc2+cShc2)/4
var haopenShc2 = 0.0
if na(haopenShc2[1])
haopenShc2 := (oShc2 + cShc2) / 2
else
haopenShc2 := (haopenShc2[1] + hacloseShc2[1]) / 2
hahighShc2 = math.max (hShc2, math.max(haopenShc2,hacloseShc2))
halowShc2 = math.min (lShc2, math.min(haopenShc2,hacloseShc2))
len2Shc2=input(10)
o2Shc2=ta.ema(haopenShc2, len2Shc2)
c2Shc2=ta.ema(hacloseShc2, len2Shc2)
h2Shc2=ta.ema(hahighShc2, len2Shc2)
l2Shc2=ta.ema(halowShc2, len2Shc2)
colShc2=o2Shc2>c2Shc2 ? color.red : color.lime
bool shc2Green = o2Shc2 > c2Shc2
bool shc2Lime = o2Shc2 < c2Shc2
//end smooth
bool shcGree = shc1Green and shc2Green
bool shcLime = shc1Lime and shc2Lime
//zlsma
lengthZlsma = input.int(title="Length", defval=32)
offset = input.int(title="Offset", defval=0)
src = input(close, title="Source")
lsma = ta.linreg(src, lengthZlsma, offset)
lsma2 = ta.linreg(lsma, lengthZlsma, offset)
eq= lsma-lsma2
zlsma = lsma+eq
// ema 10
len4 = input.int(10, minval=1, title="Length")
src4 = input.source(close, title="Source")
out4 = ta.ema(src4, len4)
//End of format
// ema 34
len5 = input.int(34, minval=1, title="Length")
src5 = input.source(close, title="Source")
out5 = ta.ema(src5, len5)
//end ema 34
// ema 99
len6 = input.int(99, minval=1, title="Length")
src6 = input.source(close, title="Source")
out6 = ta.ema(src6, len6)
// end ema 99
//kiem tra dieu kien gia dong cua lon hon ema99 thi moi me lenh long
bool onEma99 = close > out6
bool downEma99 = open < out6
if bar_index > 0
firstTrendBar = false
SAR := nextBarSAR
if bar_index == 1
float prevSAR = na
float prevEP = na
lowPrev = low[1]
highPrev = high[1]
closeCur = close
closePrev = close[1]
if closeCur > closePrev
uptrend := true
EP := high
prevSAR := lowPrev
prevEP := high
else
uptrend := false
EP := low
prevSAR := highPrev
prevEP := low
firstTrendBar := true
SAR := prevSAR + start * (prevEP - prevSAR)
if uptrend
if SAR > low
firstTrendBar := true
uptrend := false
SAR := math.max(EP, high)
EP := low
AF := start
else
if SAR < high
firstTrendBar := true
uptrend := true
SAR := math.min(EP, low)
EP := high
AF := start
if not firstTrendBar
if uptrend
if high > EP
EP := high
AF := math.min(AF + increment, maximum)
else
if low < EP
EP := low
AF := math.min(AF + increment, maximum)
if uptrend
SAR := math.min(SAR, low[1])
if bar_index > 1
SAR := math.min(SAR, low[2])
else
SAR := math.max(SAR, high[1])
if bar_index > 1
SAR := math.max(SAR, high[2])
nextBarSAR := SAR + AF * (EP - SAR)
if barstate.isconfirmed
if uptrend
// log.info("true")
strategy.entry("ParSE", strategy.short, stop=nextBarSAR, comment="ParSE")
strategy.cancel("ParLE")
shortSar := false
longSar := true
else
// log.info("false")
strategy.entry("ParLE", strategy.long, stop=nextBarSAR, comment="ParLE")
strategy.cancel("ParSE")
longSar := false
shortSar := true
// Chandelier Exit Strategy
length = input.int(title="ATR Period", defval=1)
mult = input.float(title="ATR Multiplier", step=0.1, defval=1.1)
showLabels = input.bool(title="Show Buy/Sell Labels ?", defval=true)
useClose = input.bool(title="Use Close Price for Extremums ?", defval=true)
highlightState = input.bool(title="Highlight State ?", defval=true)
atr = mult * ta.atr(length)
longStop = (useClose ? ta.highest(close, length) : ta.highest(length)) - atr
longStopPrev = nz(longStop[1], longStop)
longStop := close[1] > longStopPrev ? math.max(longStop, longStopPrev) : longStop
shortStop = (useClose ? ta.lowest(close, length) : ta.lowest(length)) + atr
shortStopPrev = nz(shortStop[1], shortStop)
shortStop := close[1] < shortStopPrev ? math.min(shortStop, shortStopPrev) : shortStop
var int dir = 1
dir := close > shortStopPrev ? 1 : close < longStopPrev ? -1 : dir
var bool longOpened = false
var bool shortOpended = false
// Entry and exit logic
if (dir == 1)
if longSar
if not longOpened
strategy.close("Sell", disable_alert = true)
strategy.order("Buy", strategy.long)
longOpened := true
shortOpended := false
if (dir == -1)
if shortSar
if not shortOpended
strategy.close("Buy", disable_alert = true)
strategy.order("Sell", strategy.short)
shortOpended := true
longOpened := false
//strategy YY
// ~~~~~~~~~~~ INPUTS ~~~~~~~~~~~ //
lenYY = input.int(80, "Trend Length:", tooltip="How far back should we span this indicator?\nThis length effects all lengths of the indicator")
purchaseSrc = input.source(close, "Purchase Source (Long and Short):", tooltip="What source needs to exit the purchase zone for a purchase to happen?")
exitSrc = input.source(close, "Exit Source (Long and Short):", tooltip="What source needs to hit a exit condition to stop the trade (Take profit, Stop Loss or hitting the other sides Purchase Zone)?")
useTakeProfit = input.bool(true, "Use Take Profit", tooltip="Should we take profit IF we cross the basis line and then cross it AGAIN?")
useStopLoss = input.bool(true, "Use Stop Loss", tooltip="Stop loss will ensure you don't lose too much if its a bad call")
stopLossMult = input.float(0.1, "Stoploss Multiplier %:", tooltip="How far from the purchase lines should the stop loss be")
resetCondition = input.string("Entry", "Reset Purchase Availability After:", options=["Entry", "Stop Loss", "None"],
tooltip="If we reset after a condition is hit, this means we can purchase again when the purchase condition is met. \n" +
"Otherwise, we will only purchase after an opposite signal has appeared.\n" +
"Entry: means when the close enters the purchase zone (buy or sell).\n" +
"Stop Loss: means when the close hits the stop loss location (even when were out of a trade)\n" +
"This allows us to get more trades and also if our stop loss initally was hit but it WAS a good time to purchase, we don't lose that chance.")
// ~~~~~~~~~~~ VARIABLES ~~~~~~~~~~~ //
var bool longStart = na
var bool longAvailable = na
var bool longTakeProfitAvailable = na
var bool longStopLoss = na
var bool shortStart = na
var bool shortAvailable = na
var bool shortTakeProfitAvailable = na
var bool shortStopLoss = na
resetAfterStopLoss = resetCondition == "Stop Loss"
resetAfterEntry = resetCondition == "Entry"
// ~~~~~~~~~~~ CALCULATIONS ~~~~~~~~~~~ //
// Mid Line
midHigh = ta.vwma(ta.highest(high, lenYY), lenYY)
midLow = ta.vwma(ta.lowest(low, lenYY), lenYY)
mid = math.avg(midHigh, midLow)
midSmoothed = ta.ema(mid, lenYY)
//Volume Filtered
avgVol = ta.vwma(volume, lenYY)
volDiff = volume / avgVol
midVolSmoothed = ta.vwma(midSmoothed * volDiff, 3)
//RSI Filtered
midDifference = ta.sma(midHigh - midLow, lenYY)
midRSI = ta.rsi(midVolSmoothed, lenYY) * 0.01
midAdd = midRSI * midDifference
//Calculate Zones
purchaseZoneHigh = midSmoothed + midAdd
purchaseZoneLow = midSmoothed - midAdd
purchaseZoneBasis = math.avg(purchaseZoneHigh, purchaseZoneLow)
//Create Stop Loss Locations
stopLossHigh = purchaseZoneHigh * (1 + (stopLossMult * 0.01))
stopLossLow = purchaseZoneLow * (1 - (stopLossMult * 0.01))
// ~~~~~~~~~~~ PURCHASE CALCULATIONS ~~~~~~~~~~~ //
//Long
longEntry = ta.crossunder(purchaseSrc, purchaseZoneLow)
longStart := ta.crossover(purchaseSrc, purchaseZoneLow) and longAvailable
longAvailable := ta.crossunder(purchaseSrc, purchaseZoneHigh) or (resetAfterStopLoss and longStopLoss) or (resetAfterEntry and longEntry) ? true : longStart ? false : longAvailable[1]
longEnd = ta.crossover(exitSrc, purchaseZoneHigh)
longStopLoss := ta.crossunder(exitSrc, stopLossLow)
longTakeProfitAvailable := ta.crossover(exitSrc, purchaseZoneBasis) ? true : longEnd ? false : longTakeProfitAvailable[1]
longTakeProfit = ta.crossunder(exitSrc, purchaseZoneBasis) and longTakeProfitAvailable
//Short
shortEntry = ta.crossover(purchaseSrc, purchaseZoneHigh)
shortStart := ta.crossunder(purchaseSrc, purchaseZoneHigh) and shortAvailable
shortAvailable := ta.crossover(purchaseSrc, purchaseZoneLow) or (resetAfterStopLoss and shortStopLoss) or (resetAfterEntry and shortEntry)? true : shortStart ? false : shortAvailable[1]
shortEnd = ta.crossunder(exitSrc, purchaseZoneLow)
shortStopLoss := ta.crossover(exitSrc, stopLossHigh)
shortTakeProfitAvailable := ta.crossunder(exitSrc, purchaseZoneBasis) ? true : shortEnd ? false : shortTakeProfitAvailable[1]
shortTakeProfit = ta.crossover(exitSrc, purchaseZoneBasis) and shortTakeProfitAvailable
// ~~~~~~~~~~~ STRATEGY ~~~~~~~~~~~ //
var bool openLongYY = false
var bool openShortYY = false
if (longStart)
strategy.order("BuyYY", strategy.long)
strategy.close("SellYY", disable_alert = true)
openLongYY := true
openShortYY := false
else if (longEnd or (useStopLoss and longStopLoss) or (useTakeProfit and longTakeProfit))
strategy.close("BuyYY", disable_alert = true)
if (shortStart)
strategy.close("BuyYY", disable_alert = true)
strategy.order("SellYY", strategy.short)
openShortYY := true
openLongYY := false
else if (shortEnd or (useStopLoss and shortStopLoss) or (useTakeProfit and shortTakeProfit))
strategy.close("SellYY", disable_alert = true)
// ~~~~~~~~~~~ ALERTS ~~~~~~~~~~~ //
// if longStart or (longEnd or (useStopLoss and longStopLoss) or (useTakeProfit and longTakeProfit)) or shortStart or (shortEnd or (useStopLoss and shortStopLoss) or (useTakeProfit and shortTakeProfit))
// alert("{{strategy.order.action}} | {{ticker}} | {{close}}", alert.freq_once_per_bar)
// Plotting
plot(SAR, style=plot.style_cross, linewidth=1, color=color.orange)
plot(nextBarSAR, style=plot.style_cross, linewidth=3, color=color.aqua)
plot(zlsma, color=color.rgb(235, 15, 33), linewidth=1, title = "ZLSMA")
plot(out4, color=color.rgb(24, 209, 85), title="Ema 1")
plot(out5, color=color.rgb(139, 234, 231), linewidth = 2, title="Ema 2")
plot(out6, color=color.rgb(219, 230, 18), title="Ema 3")
plotcandle(o2, h2, l2, c2, title="SHC1", color=col)
plotcandle(o2Shc2, hShc2, l2Shc2, c2Shc2, title="SHC2", color=col)
// ~~~~~~~~~~~ PLOTS YY ~~~~~~~~~~~ //
shortLine = plot(purchaseZoneHigh, color=color.green)
shortStopLossLine = plot(stopLossHigh, color=color.green) //color=color.rgb(0, 97, 3)
fill(shortLine, shortStopLossLine, color = color.new(color.green, 90))
plot(purchaseZoneBasis, color=color.white)
longLine = plot(purchaseZoneLow, color=color.red)
longStopLossLine = plot(stopLossLow, color=color.red) //color=color.rgb(105, 0, 0)
fill(longLine, longStopLossLine, color=color.new(color.red, 90))