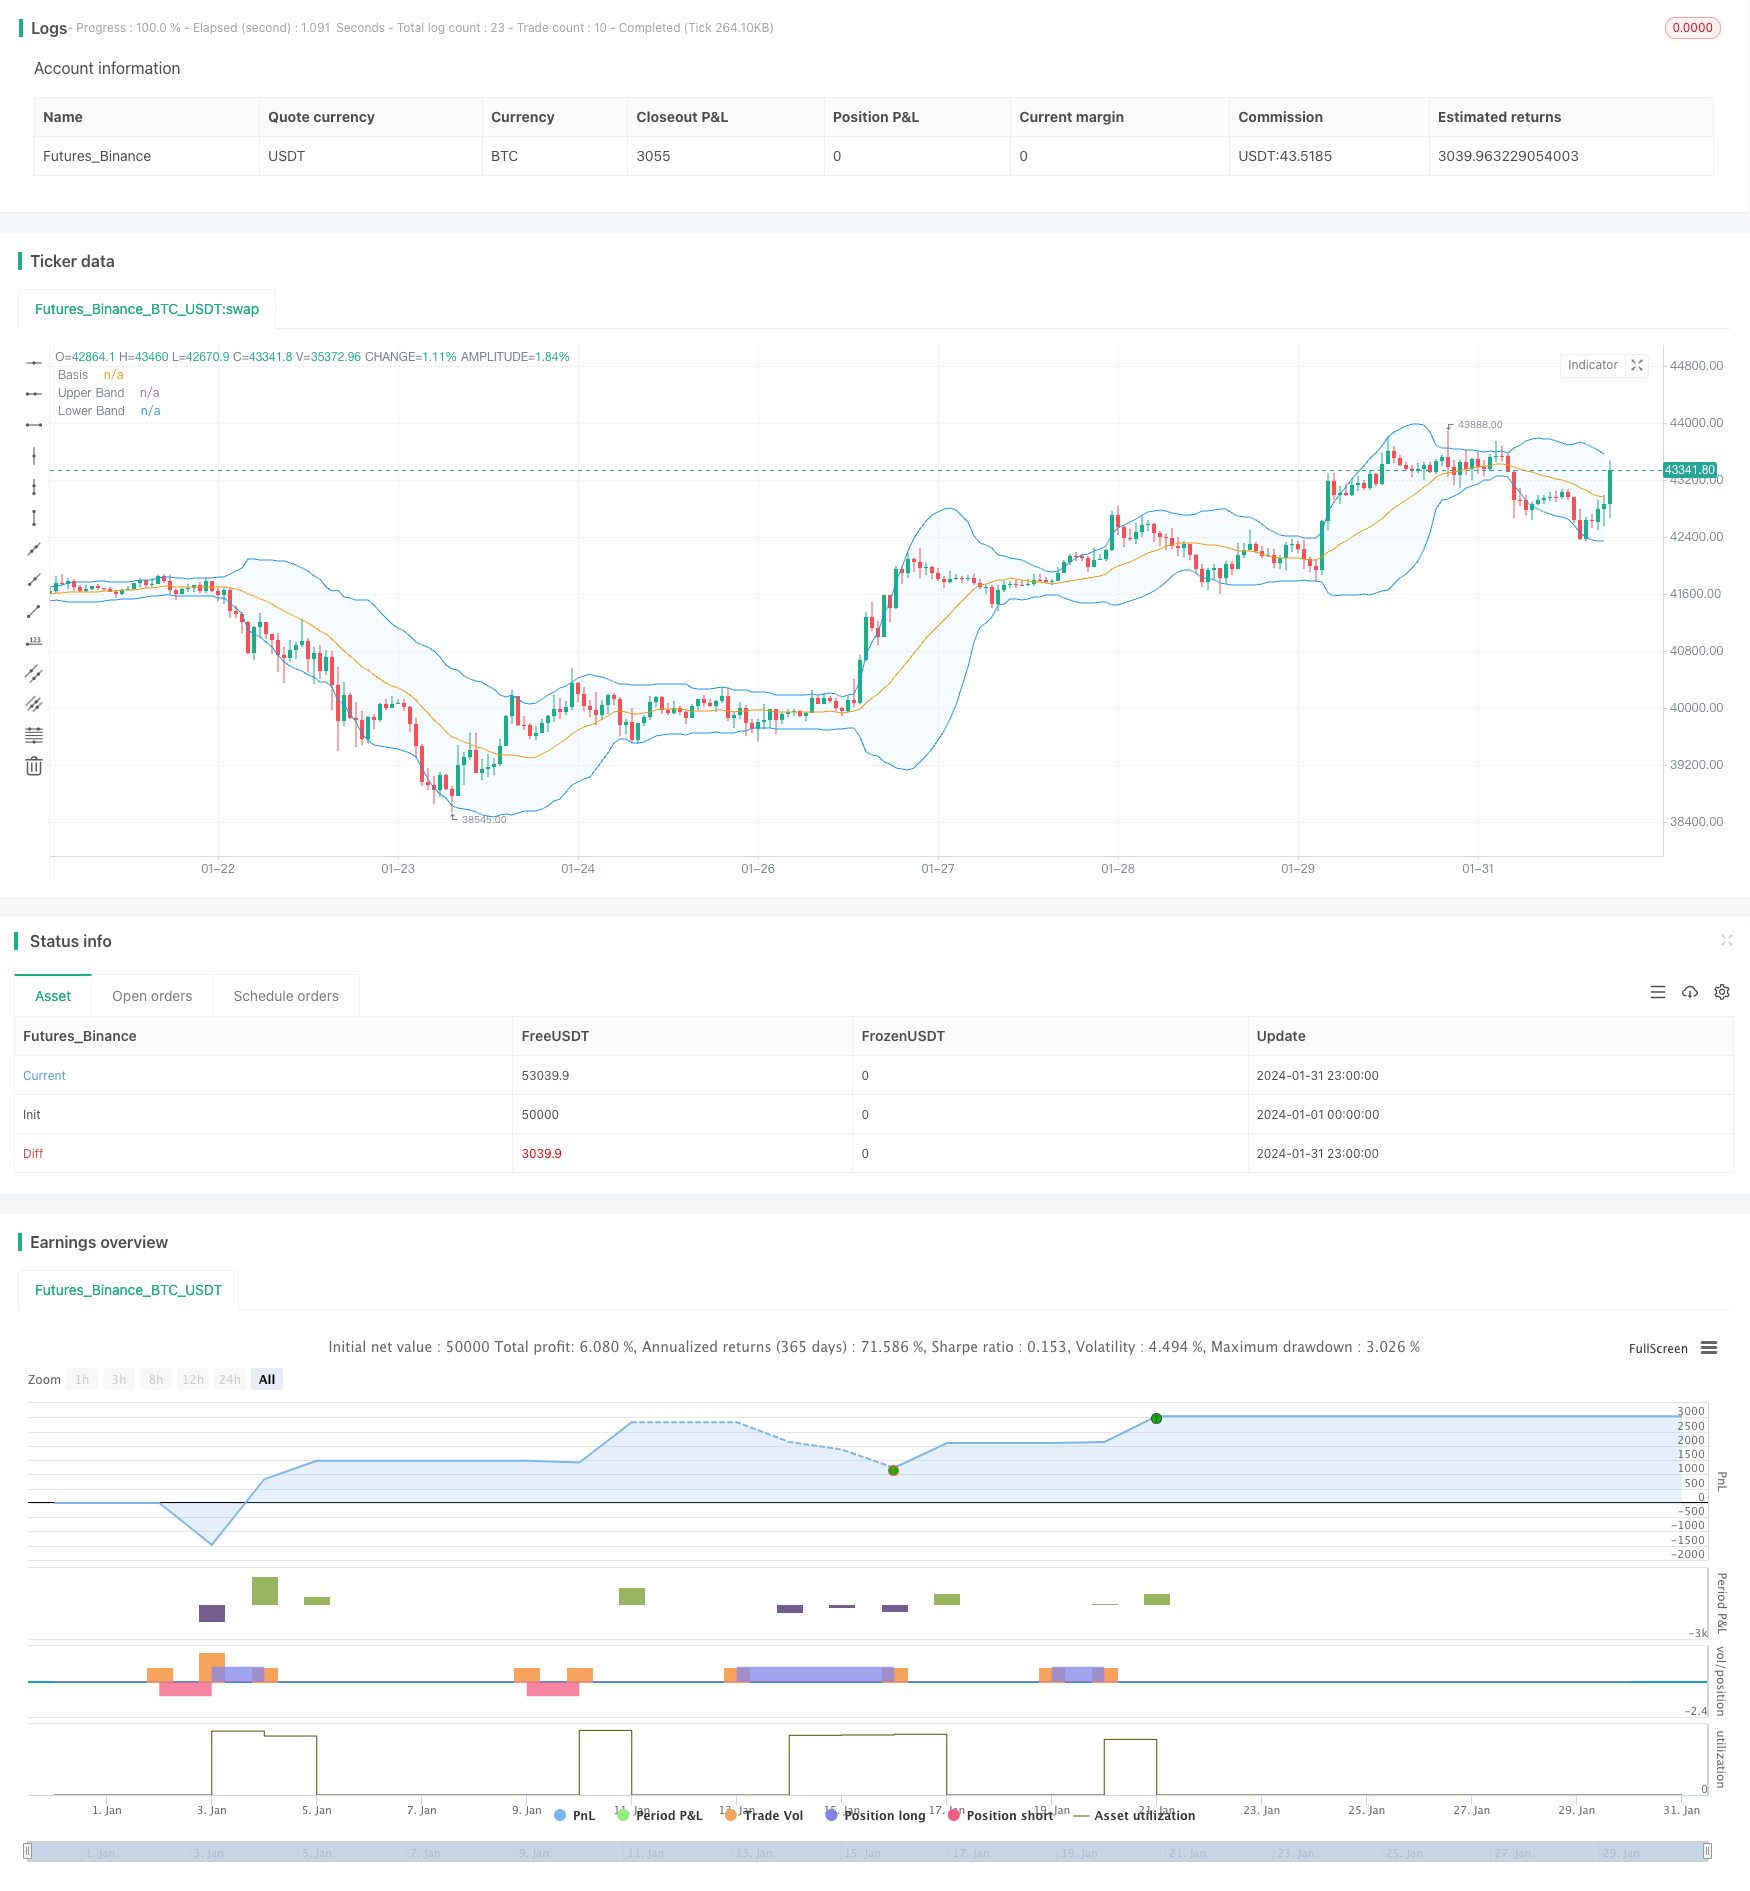
ボリンジャーバンドブレイクアウトとRSIインジケーターに基づくマルチタイムフレームトレンド戦略

概要
この戦略は,ブリン帯の指標,RSI指標,および複数の時間枠分析を融合させ,中長期トレンドの方向を捉えることを目的としています.ブリン帯の上線と下線突破を介して,RSIオーバーバイズ・セールシグナルと組み合わせてトレンドの逆転点を判断し,低リスクのエントリーを実現します.同時に,より高い時間枠のフィルタリングを行います.
戦略原則
ブリン帯の指数は,価格の突破を判断する. ブリン帯の中軌は,N日閉盤価格の移動平均であり,上軌と下軌は,中軌上下それぞれ1つの標準差である. 閉盤価格が上軌を突破すると強気信号であり,下軌を突破すると弱気信号である.
RSI指標と組み合わせて,超買超売現象を判断する。RSIが70より大きいのは超買区,30より小さいのは超売区である。RSIが下から上へ70を突破すると,超買状態にあると考えられ,ブリンが上線突破をトレンドの逆転の確認としてする。RSIが上から下へ30を突破すると,超売り状態にあると考えられ,ブリンが下線突破をトレンドの逆転の確認としてする。
より高い時間枠で偽突破をフィルタリングする.当日線で突破信号が発生した場合は,確認として4時間以上の時間枠が必要で,被套を避ける.
戦略的優位性
複数の指標を融合させ,戦略の安定性と収益性を向上させる.
RSI指標は反転点を判断し,偽突破による損失を減らすことができます.
複数のタイムフレームを分析し,震動の動きを効果的にフィルターし,被套を避ける.
突破シグナル判断を最適化して,トレンドが成熟した後に再入場することを確保する.
Vortexはトレンドの方向を判断し,新しいトレンドが形成され始めているのを捉えます.
戦略リスク
ブリン帯のパラメータを正しく設定しない場合,オーバーバイオーバーセールシグナルに誤りが生じます.
RSIパラメータの設定は,異なる品種に応じて合理的な値を決定する必要があります.
突破シグナルに偽突破が発生する可能性があるので,適切なストップダメージ差を拡大する.
ATRの3倍の十分なストップ・ローズを保証する.
戦略最適化の方向性
ブリン帯とRSIのパラメータをリアルタイムに最適化する機械学習アルゴリズムを適用する.
波動率指標を利用してストップ・ローズ差を最適化する.
取引量制御モジュールを追加し,市場の変化に応じてポジションを調整する.
資金管理の原則と連携して,単一取引の損失率を制限する.
異なる取引時間における突破信号の安定性を評価する.
要約する
この戦略は,トレンド判断,オーバーバイオーバーセール現象,多時間枠分析など,さまざまな技術指標を総合的に考慮し,リスクを制御する前提のもと,適切な入場タイミングを選択し,中長期線質量トレンドを捕捉し,優れた利益率を得ることができる.また,パラメータ調整,止損機構の改善などの手段によって,さらなる最適化の余地があり,優れた投資業績を得ることが期待される.
/*backtest
start: 2024-01-01 00:00:00
end: 2024-01-31 23:59:59
period: 1h
basePeriod: 15m
exchanges: [{"eid":"Futures_Binance","currency":"BTC_USDT"}]
*/

// This Pine Script™ code is subject to the terms of the Mozilla Public License 2.0 at https://mozilla.org/MPL/2.0/
// © Noway0utstorm
//@version=5
strategy(title='Vortex0.71.3 + bb 3bar breakout + rsi - close hit upper or lower', shorttitle='truongphuthinh', format=format.price, precision=4,overlay = true)

length = input(20, title="Length")
mult = input(2.0, title="Multiplier")
source = close

basis = ta.sma(source, length)
dev = mult * ta.stdev(source, length)

upperBand = basis + dev
lowerBand = basis - dev

isClosedBar = ta.change(time("15"))

var bool closeAboveUpperBand = false
var bool closeBelowLowerBand = false


// Vortex Indicator Settings
period_ = input.int(14, title='Period', minval=2)

VMP = math.sum(math.abs(high - low[1]), period_)
VMM = math.sum(math.abs(low - high[1]), period_)
STR = math.sum(ta.atr(1), period_)
VIP = VMP / STR
VIM = VMM / STR

//
lengthrsi = input(14, title="RSI Length")
overboughtLevel = input(70, title="Overbought Level")
oversoldLevel = input(30, title="Oversold Level")

sourcersi = close
rsiValue = ta.rsi(sourcersi, lengthrsi)

shouldShort = rsiValue > overboughtLevel
shouldLong = rsiValue < oversoldLevel


if bool(isClosedBar[1]) and bool(isClosedBar[2]) and bool(isClosedBar[3])

    if close[1] > upperBand[1] and close[2] > upperBand[2] and close[3] > upperBand[3] and VIP > 1.25 and VIM < 0.7 and rsiValue > overboughtLevel
        strategy.entry("Short", strategy.short)
        closeAboveUpperBand := false  // Reset the condition when entering a new Short position
    if close[1] < lowerBand[1] and close[2] < lowerBand[2] and close[3] < lowerBand[3] and VIP < 0.7 and VIM > 1.25 and rsiValue < oversoldLevel
        strategy.entry("Long", strategy.long)
        closeBelowLowerBand := false  // Reset the condition when entering a new Long position


if strategy.position_size > 0  // Check if there is an open Long position
    closeAboveUpperBand := close > upperBand  // Update the condition based on close price
    if closeAboveUpperBand
        strategy.close("Long",disable_alert=true)  // Close the Long position if close price is above upper band

if strategy.position_size < 0  // Check if there is an open Short position
    closeBelowLowerBand := close < lowerBand  // Update the condition based on close price
    if closeBelowLowerBand
        strategy.close("Short",disable_alert=true)  // Close the Short position if close price is below lower band

// Plots
plot(basis, color=color.orange, title="Basis")
p1 = plot(upperBand, color=color.blue, title="Upper Band")
p2 = plot(lowerBand, color=color.blue, title="Lower Band")
fill(p1, p2, title = "Background", color=color.rgb(33, 150, 243, 95))