移動平均回帰のブレークスルーに基づくトレンドフォロー戦略

1
Follow
1782
Followers
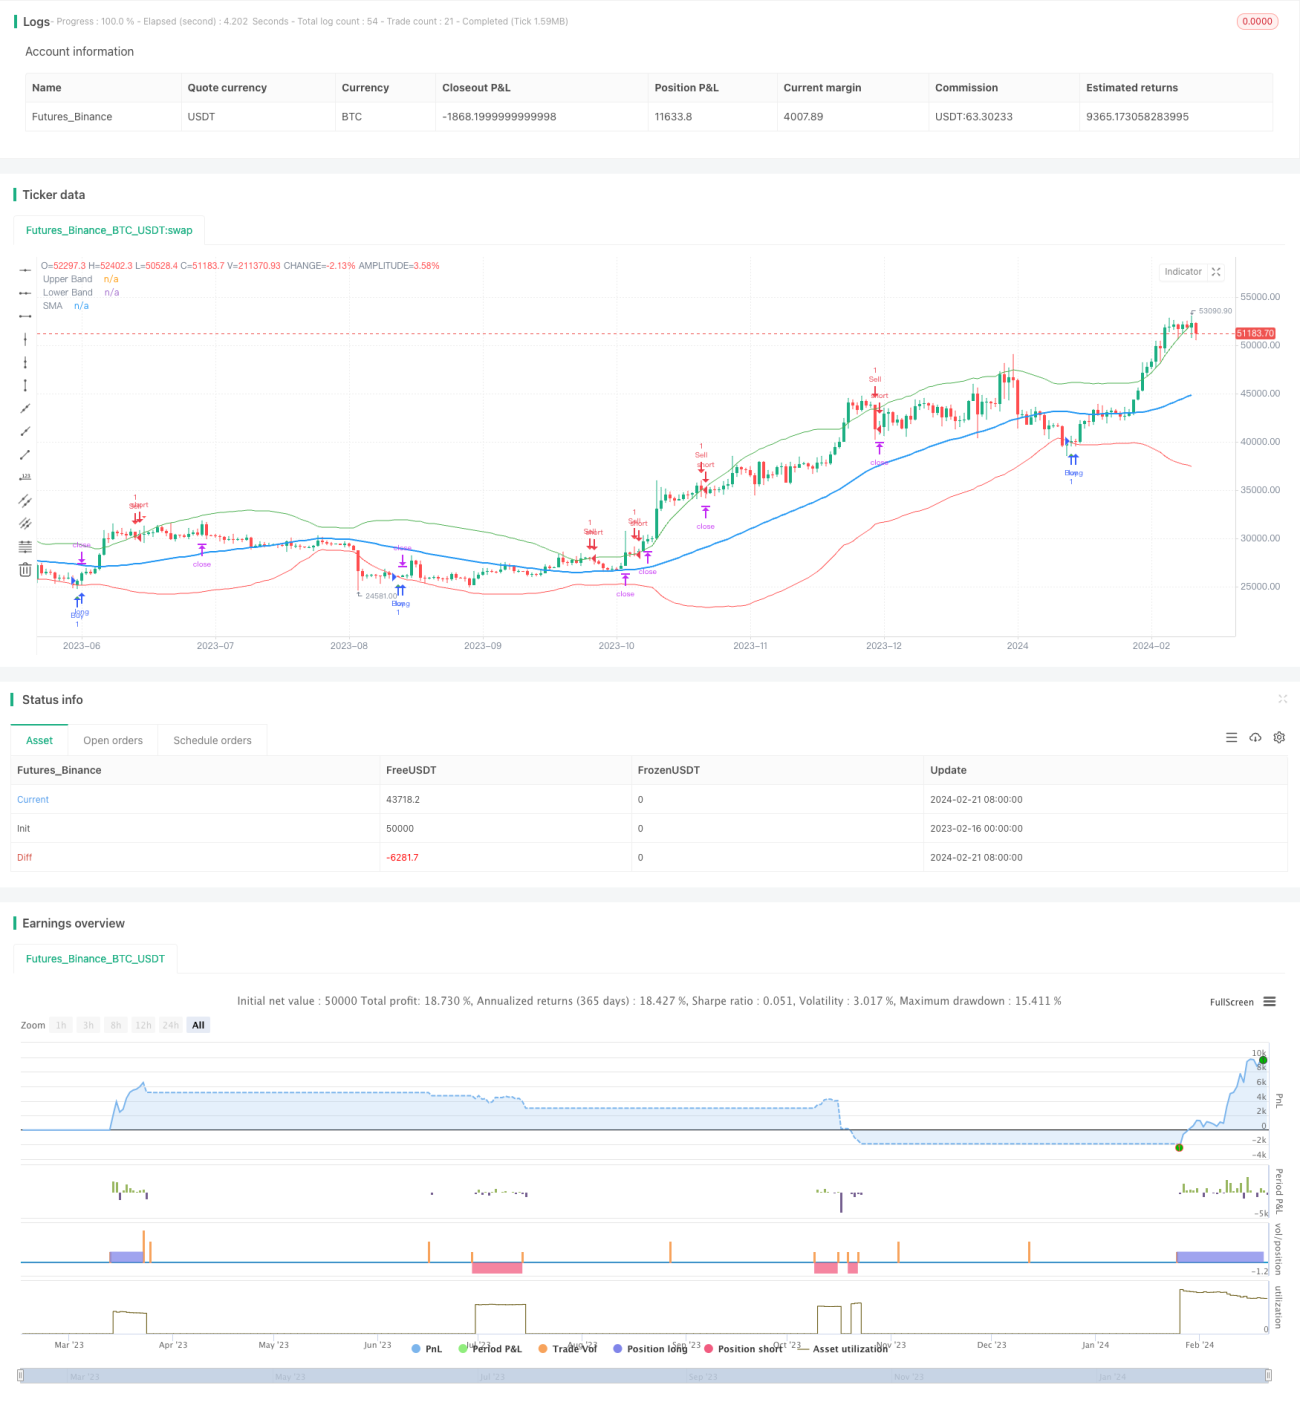
概要
平均回帰突破策は,典型的なトレンドを追跡する量化取引策である.この策は,移動平均と標準差チャネルを使用して,市場の動きを判断し,価格が標準差チャネルを破るときに取引シグナルを生成する.
戦略原則
この戦略は,まず,N日 (デフォルト50日) のシンプル移動平均SMAを計算し,その後,SMAをベースに,この周期の価格の標準差StdDevを計算します. 中央軸はSMAで,上下はStdDevの2倍で,上下軌を構成する<unk>標準差チャネル<unk>です. 上向きに走る時,空を空にする. 下向きに走る時,多めにする.
市場に入ると,戦略はストップ・ロスの位置を設定する.具体的には,オーバーの後に,ストップ・ロスのラインは,入場時の閉店価格の ((100 - ストップ・ロスのパーセント);空白の後に,ストップ・ホールドラインは,入場時の閉店価格の ((100 + ストップ・ホールドのパーセント) になる.
優位分析
この戦略の利点は以下の通りです.
- 傾向を追跡する能力がある.標準差チャネルを使用することで,市場の変動を動的に追跡することができる.
- 撤回制御能力が強い。移動止損を使用することで単一損失を効果的に制御することができる。
- 実行しやすい. 参数最適化も省いて,実行しやすい.
リスク分析
この戦略にはいくつかのリスクがあります.
- トレンド反転リスク. トレンド追跡戦略は,負債の退出と反転が容易である場合.
- 参数敏感リスク. 移動平均周期と標準差倍数の参数選択は,戦略のパフォーマンスに大きな影響を与える.
- ストップダメージが激進すぎると,追加ダメージが発生しやすい. ストップダメージの設定が不適切であれば,追加ダメージが発生する可能性があります.
リスクに対応する解決策は以下の通りです.
- 波動率指数と組み合わせると偽突破を避ける.
- パラメータを最適化して,最適なパラメータの組み合わせを探します.
- リスクの調整を進めて 極端な動きを防ぐこと.
最適化の方向
この戦略をさらに改善する余地があります.
-
複数の時間周期の均線を用いて検証し,曲線を過度に敏感にしない.
-
MACDなどの他の指標と組み合わせた判断傾向と偏差現象.
-
機械学習アルゴリズムの動的最適化パラメータを導入する.
要約する
均線回帰突破戦略は全体的に非常に実用的な量化取引戦略である. それは,トレンドを追跡し,撤回を制御する利点を持ち,単純に,量化取引の必要性に適した実現する. 同時に,いくつかのパラメータ選択と止損設定の問題にも注意する必要がある. 多時間軸分析とパラメータ最適化と組み合わせて,より良い戦略パフォーマンスを得ることができる.
Source
Pine
Strategy parameters
Related strategies
Comment
All comments (0)
No data
- 1