ガウスチャネルトレンドフォロー戦略
作成日:
2024-03-29 16:26:26
最終変更日:
2024-03-29 16:26:26
コピー:
7
クリック数:
1409
1
フォロー
1751
フォロワー
概要
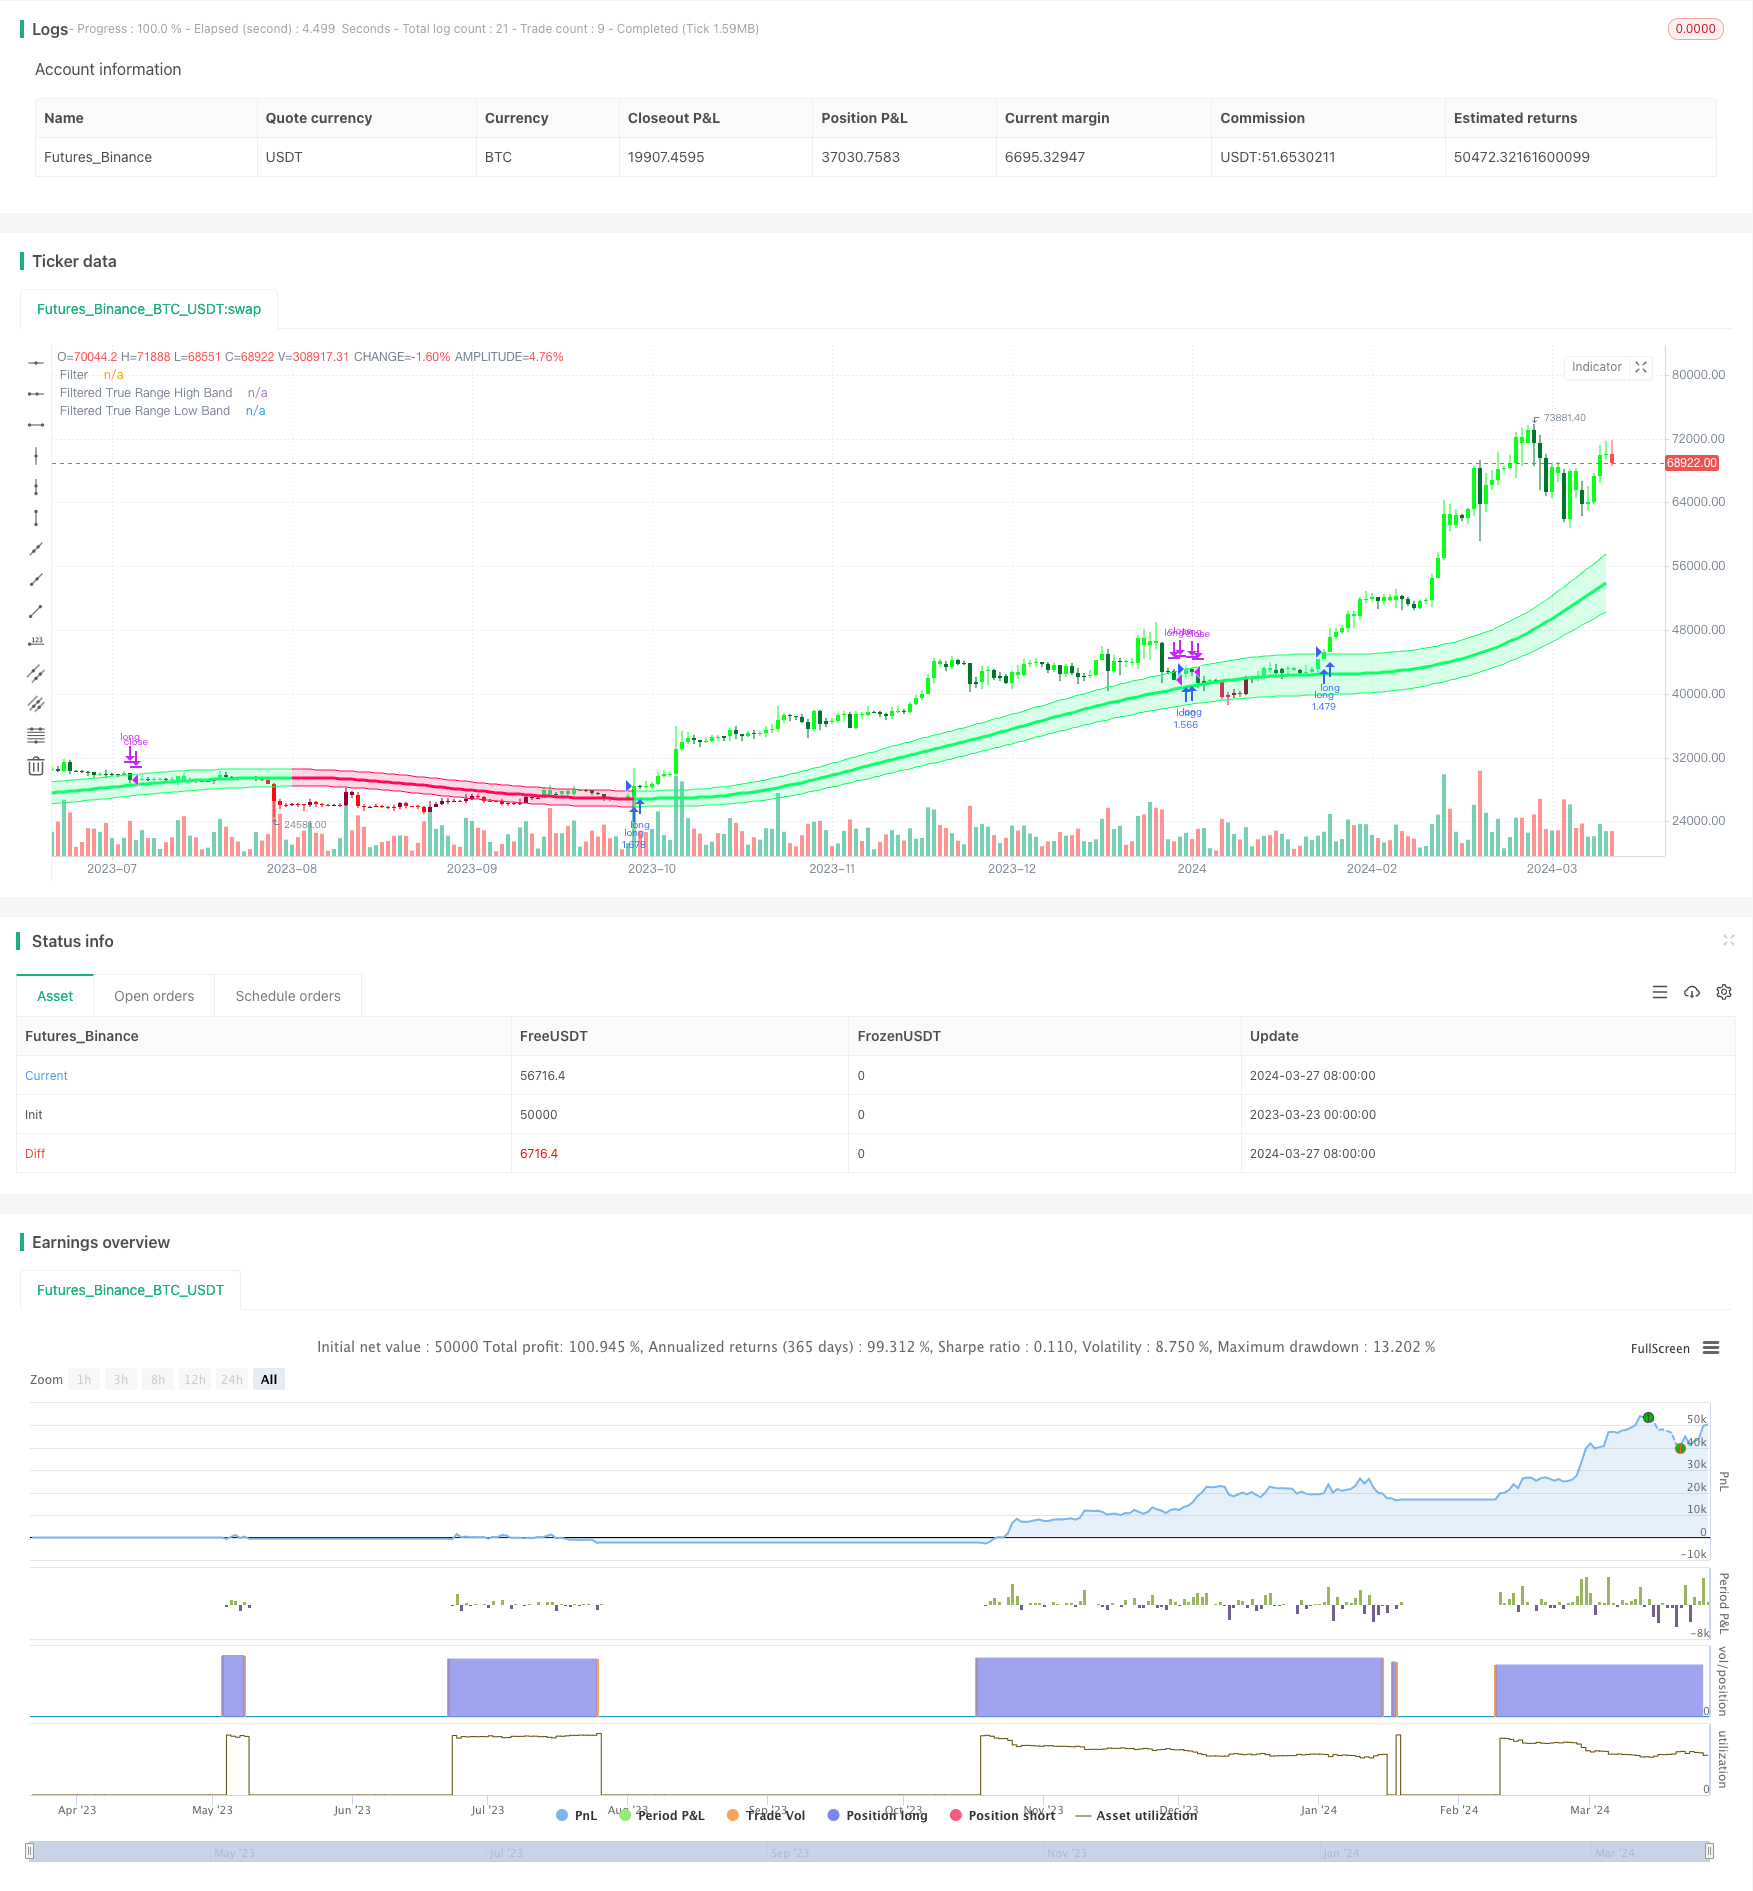
ガウスチャンネルのトレンド追跡戦略は,ガウスチャンネルの指数に基づくトレンド追跡取引戦略である.この戦略は,市場の主要トレンドを捕捉し,上昇傾向で買い出し,ポジションを保持し,下降傾向で平仓を観察することを目的としている.戦略は,ガウスチャンネルの指数を使用して,トレンドの方向と強さを識別し,価格とチャネルの上下線との関係を分析することによって,買い売りを決定する.チャンネルの戦略の主要な目的は,トレンドが続く間,可能な限り多くの利益を得ることであり,揺れ動いている市場で頻繁に取引を避けるようにすることです.
戦略原則
Gaussian Channelトレンド追跡戦略の核心は,Gaussian Channel指標である.Gaussian Channel指標は,Ehlersによって提案され,高波技術と真範囲を組み合わせたトレンド分析ツールである.指標は,まず,サンプリング周期と極点数に基づいてβとα値を計算し,データに波処理を行い,平らな曲線を得る.
戦略的優位性
- トレンド追跡:この戦略は,市場の主要トレンドを把握し,トレンドの方向に投資することで,長期にわたる安定した利益を得ることができます.
- 取引頻度を減らす:トレンドが確認されたときにのみ入場し,トレンドが続く間,ポジションを保持する戦略で,不必要な取引回数と取引コストを減らす.
- 遅延を減らす:遅延モードと迅速な反応モードを減らすことで,戦略は市場変化により早く反応することができます.
- パラメータの柔軟性: ユーザは,戦略のパフォーマンスを最適化するために,サンプル周期,極点数,実際の範囲倍数などの戦略のパラメータを自身のニーズに応じて調整できます.
戦略リスク
- パラメータ最適化のリスク:不適切なパラメータ設定は,戦略の不良なパフォーマンスを引き起こす可能性があります.最適なパラメータ組み合わせを見つけるために,異なる市場環境でパラメータ最適化と反射をすることが推奨されています.
- トレンド転換リスク:市場トレンドが突然転換したとき,戦略は大きな引き下がりを引き起こす可能性があります. リスクは,ストップ・ロスを設定するか,他の指標を導入することによって制御できます.
- 震動市場リスク: 震動市場では,戦略が頻繁に取引信号を発生させ,収益を損なう可能性があります. 信号を最適化パラメータまたは他の技術指標と組み合わせてフィルターすることができます.
戦略最適化の方向性
- 他の技術指標の導入:信号の正確性と信頼性を高めるために,MACD,RSIなどの他のトレンドクラスまたは震動クラス指標と組み合わせる.
- 動的パラメータ最適化:市場の状況の変化に応じて,異なる市場環境に対応するために戦略パラメータを動的に調整する.
- リスク管理モジュールへの追加:合理的なストップ・ロズとストップ・ストップのルールを設定し,単一取引のリスクと全体的な撤回レベルを制御する.
- 多時間枠分析:日線,4時間線などの異なる時間周期の信号を組み合わせて,より包括的な市場情報を得る.
要約する
ガウスチャンネルのトレンド追跡戦略は,ガウスチャンネルの技術に基づくトレンド追跡取引戦略で,市場の主要トレンドを捉えることで長期にわたる安定した利益を得ます. 戦略は,ガウスチャンネルの指標を使用して,トレンドの方向と強さを識別し,遅延と迅速な反応を減らす機能を備えています. 戦略の優点は,トレンド追跡能力と取引頻度の低さにあります. しかし,パラメータ最適化,トレンド転換,震動市場などのリスクにも直面しています. 将来,他の技術指標,動態パラメータ最適化,リスク制御モジュールとマルチタイムフレーム分析などの方法を導入することで,戦略を最適化することができ,その安定性と収益性をさらに向上させます.
ストラテジーソースコード
/*backtest
start: 2023-03-23 00:00:00
end: 2024-03-28 00:00:00
period: 1d
basePeriod: 1h
exchanges: [{"eid":"Futures_Binance","currency":"BTC_USDT"}]
*/

//@version=5
strategy(title="Gaussian Channel Strategy v2.0", overlay=true, calc_on_every_tick=false, initial_capital=1000, default_qty_type=strategy.percent_of_equity, default_qty_value=100, commission_type=strategy.commission.percent, commission_value=0.1, slippage=3)

//-----------------------------------------------------------------------------------------------------------------------------------------------------------------
// Gaussian Channel Indicaor - courtesy of @DonovanWall
//-----------------------------------------------------------------------------------------------------------------------------------------------------------------

// Date condition inputs
startDate = input(timestamp("1 January 2018 00:00 +0000"), "Date Start", group="Main Algo Settings")
endDate = input(timestamp("1 January 2060 00:00 +0000"), "Date Start", group="Main Algo Settings")
timeCondition = true

// This study is an experiment utilizing the Ehlers Gaussian Filter technique combined with lag reduction techniques and true range to analyze trend activity.
// Gaussian filters, as Ehlers explains it, are simply exponential moving averages applied multiple times.
// First, beta and alpha are calculated based on the sampling period and number of poles specified. The maximum number of poles available in this script is 9.
// Next, the data being analyzed is given a truncation option for reduced lag, which can be enabled with "Reduced Lag Mode".
// Then the alpha and source values are used to calculate the filter and filtered true range of the dataset.
// Filtered true range with a specified multiplier is then added to and subtracted from the filter, generating a channel.
// Lastly, a one pole filter with a N pole alpha is averaged with the filter to generate a faster filter, which can be enabled with "Fast Response Mode".

// Custom bar colors are included.

// Note: Both the sampling period and number of poles directly affect how much lag the indicator has, and how smooth the output is.
//      Larger inputs will result in smoother outputs with increased lag, and smaller inputs will have noisier outputs with reduced lag.
//      For the best results, I recommend not setting the sampling period any lower than the number of poles + 1. Going lower truncates the equation.

//-----------------------------------------------------------------------------------------------------------------------------------------------------------------
// Updates:
// Huge shoutout to @e2e4mfck for taking the time to improve the calculation method!
// -> migrated to v4
// -> pi is now calculated using trig identities rather than being explicitly defined.
// -> The filter calculations are now organized into functions rather than being individually defined.
// -> Revamped color scheme.

//-----------------------------------------------------------------------------------------------------------------------------------------------------------------
// Functions - courtesy of @e2e4mfck
//-----------------------------------------------------------------------------------------------------------------------------------------------------------------

// Filter function
f_filt9x (_a, _s, _i) =>
    int _m2 = 0, int _m3 = 0, int _m4 = 0, int _m5 = 0, int _m6 = 0,
    int _m7 = 0, int _m8 = 0, int _m9 = 0, float _f = .0, _x = (1 - _a)
    // Weights.
    // Initial weight _m1 is a pole number and equal to _i
    _m2 := _i == 9 ? 36  : _i == 8 ? 28 : _i == 7 ? 21 : _i == 6 ? 15 : _i == 5 ? 10 : _i == 4 ? 6 : _i == 3 ? 3 : _i == 2 ? 1 : 0
    _m3 := _i == 9 ? 84  : _i == 8 ? 56 : _i == 7 ? 35 : _i == 6 ? 20 : _i == 5 ? 10 : _i == 4 ? 4 : _i == 3 ? 1 : 0
    _m4 := _i == 9 ? 126 : _i == 8 ? 70 : _i == 7 ? 35 : _i == 6 ? 15 : _i == 5 ? 5  : _i == 4 ? 1 : 0
    _m5 := _i == 9 ? 126 : _i == 8 ? 56 : _i == 7 ? 21 : _i == 6 ? 6  : _i == 5 ? 1  : 0
    _m6 := _i == 9 ? 84  : _i == 8 ? 28 : _i == 7 ? 7  : _i == 6 ? 1  : 0
    _m7 := _i == 9 ? 36  : _i == 8 ? 8  : _i == 7 ? 1  : 0
    _m8 := _i == 9 ? 9   : _i == 8 ? 1  : 0
    _m9 := _i == 9 ? 1   : 0
    // filter
    _f :=   math.pow(_a, _i) * nz(_s) +
      _i  *     _x      * nz(_f[1])      - (_i >= 2 ?
      _m2 * math.pow(_x, 2)  * nz(_f[2]) : 0) + (_i >= 3 ?
      _m3 * math.pow(_x, 3)  * nz(_f[3]) : 0) - (_i >= 4 ?
      _m4 * math.pow(_x, 4)  * nz(_f[4]) : 0) + (_i >= 5 ?
      _m5 * math.pow(_x, 5)  * nz(_f[5]) : 0) - (_i >= 6 ?
      _m6 * math.pow(_x, 6)  * nz(_f[6]) : 0) + (_i >= 7 ?
      _m7 * math.pow(_x, 7)  * nz(_f[7]) : 0) - (_i >= 8 ?
      _m8 * math.pow(_x, 8)  * nz(_f[8]) : 0) + (_i == 9 ?
      _m9 * math.pow(_x, 9)  * nz(_f[9]) : 0)

// 9 var declaration fun
f_pole (_a, _s, _i) =>
    _f1 =            f_filt9x(_a, _s, 1),      _f2 = (_i >= 2 ? f_filt9x(_a, _s, 2) : 0), _f3 = (_i >= 3 ? f_filt9x(_a, _s, 3) : 0)
    _f4 = (_i >= 4 ? f_filt9x(_a, _s, 4) : 0), _f5 = (_i >= 5 ? f_filt9x(_a, _s, 5) : 0), _f6 = (_i >= 6 ? f_filt9x(_a, _s, 6) : 0)
    _f7 = (_i >= 2 ? f_filt9x(_a, _s, 7) : 0), _f8 = (_i >= 8 ? f_filt9x(_a, _s, 8) : 0), _f9 = (_i == 9 ? f_filt9x(_a, _s, 9) : 0)
    _fn = _i == 1 ? _f1 : _i == 2 ? _f2 : _i == 3 ? _f3 :
      _i == 4     ? _f4 : _i == 5 ? _f5 : _i == 6 ? _f6 :
      _i == 7     ? _f7 : _i == 8 ? _f8 : _i == 9 ? _f9 : na
    [_fn, _f1]

//-----------------------------------------------------------------------------------------------------------------------------------------------------------------
// Inputs
//-----------------------------------------------------------------------------------------------------------------------------------------------------------------

// Source
src = input(defval=hlc3, title="Source")

// Poles
int N = input.int(defval=4, title="Poles", minval=1, maxval=9)

// Period
int per = input.int(defval=144, title="Sampling Period", minval=2)

// True Range Multiplier
float mult = input.float(defval=1.414, title="Filtered True Range Multiplier", minval=0)

// Lag Reduction
bool modeLag  = input.bool(defval=false, title="Reduced Lag Mode")
bool modeFast = input.bool(defval=false, title="Fast Response Mode")

//-----------------------------------------------------------------------------------------------------------------------------------------------------------------
// Definitions
//-----------------------------------------------------------------------------------------------------------------------------------------------------------------

// Beta and Alpha Components
beta  = (1 - math.cos(4*math.asin(1)/per)) / (math.pow(1.414, 2/N) - 1)
alpha = - beta + math.sqrt(math.pow(beta, 2) + 2*beta)

// Lag
lag = (per - 1)/(2*N)

// Data
srcdata = modeLag ? src + (src - src[lag]) : src
trdata  = modeLag ? ta.tr(true) + (ta.tr(true) - ta.tr(true)[lag]) : ta.tr(true)

// Filtered Values
[filtn, filt1]     = f_pole(alpha, srcdata, N)
[filtntr, filt1tr] = f_pole(alpha, trdata,  N)

// Lag Reduction
filt   = modeFast ? (filtn + filt1)/2 : filtn
filttr = modeFast ? (filtntr + filt1tr)/2 : filtntr

// Bands
hband = filt + filttr*mult
lband = filt - filttr*mult

// Colors
color1   = #0aff68
color2   = #00752d
color3   = #ff0a5a
color4   = #990032
fcolor   = filt > filt[1] ? #0aff68 : filt < filt[1] ? #ff0a5a : #cccccc
barcolor = (src > src[1]) and (src > filt) and (src < hband) ? #0aff68 : (src > src[1]) and (src >= hband) ? #0aff1b : (src <= src[1]) and (src > filt) ? #00752d :
           (src < src[1]) and (src < filt) and (src > lband) ? #ff0a5a : (src < src[1]) and (src <= lband) ? #ff0a11 : (src >= src[1]) and (src < filt) ? #990032 : #cccccc

//-----------------------------------------------------------------------------------------------------------------------------------------------------------------
// Outputs
//-----------------------------------------------------------------------------------------------------------------------------------------------------------------

// Filter Plot
filtplot = plot(filt, title="Filter", color=fcolor, linewidth=3)

// Band Plots
hbandplot = plot(hband, title="Filtered True Range High Band", color=fcolor)
lbandplot = plot(lband, title="Filtered True Range Low Band", color=fcolor)

// Channel Fill
fill(hbandplot, lbandplot, title="Channel Fill", color=color.new(fcolor, 80))

// Bar Color
barcolor(barcolor)

longCondition = ta.crossover(close, hband) and timeCondition
closeAllCondition = ta.crossunder(close, hband) and timeCondition

if longCondition
    strategy.entry("long", strategy.long)

if closeAllCondition
    strategy.close("long")