볼링거 + RSI, 더블 전략 v1.1
저자:차오장, 날짜: 2022-05-07 14:59:50태그:RSI
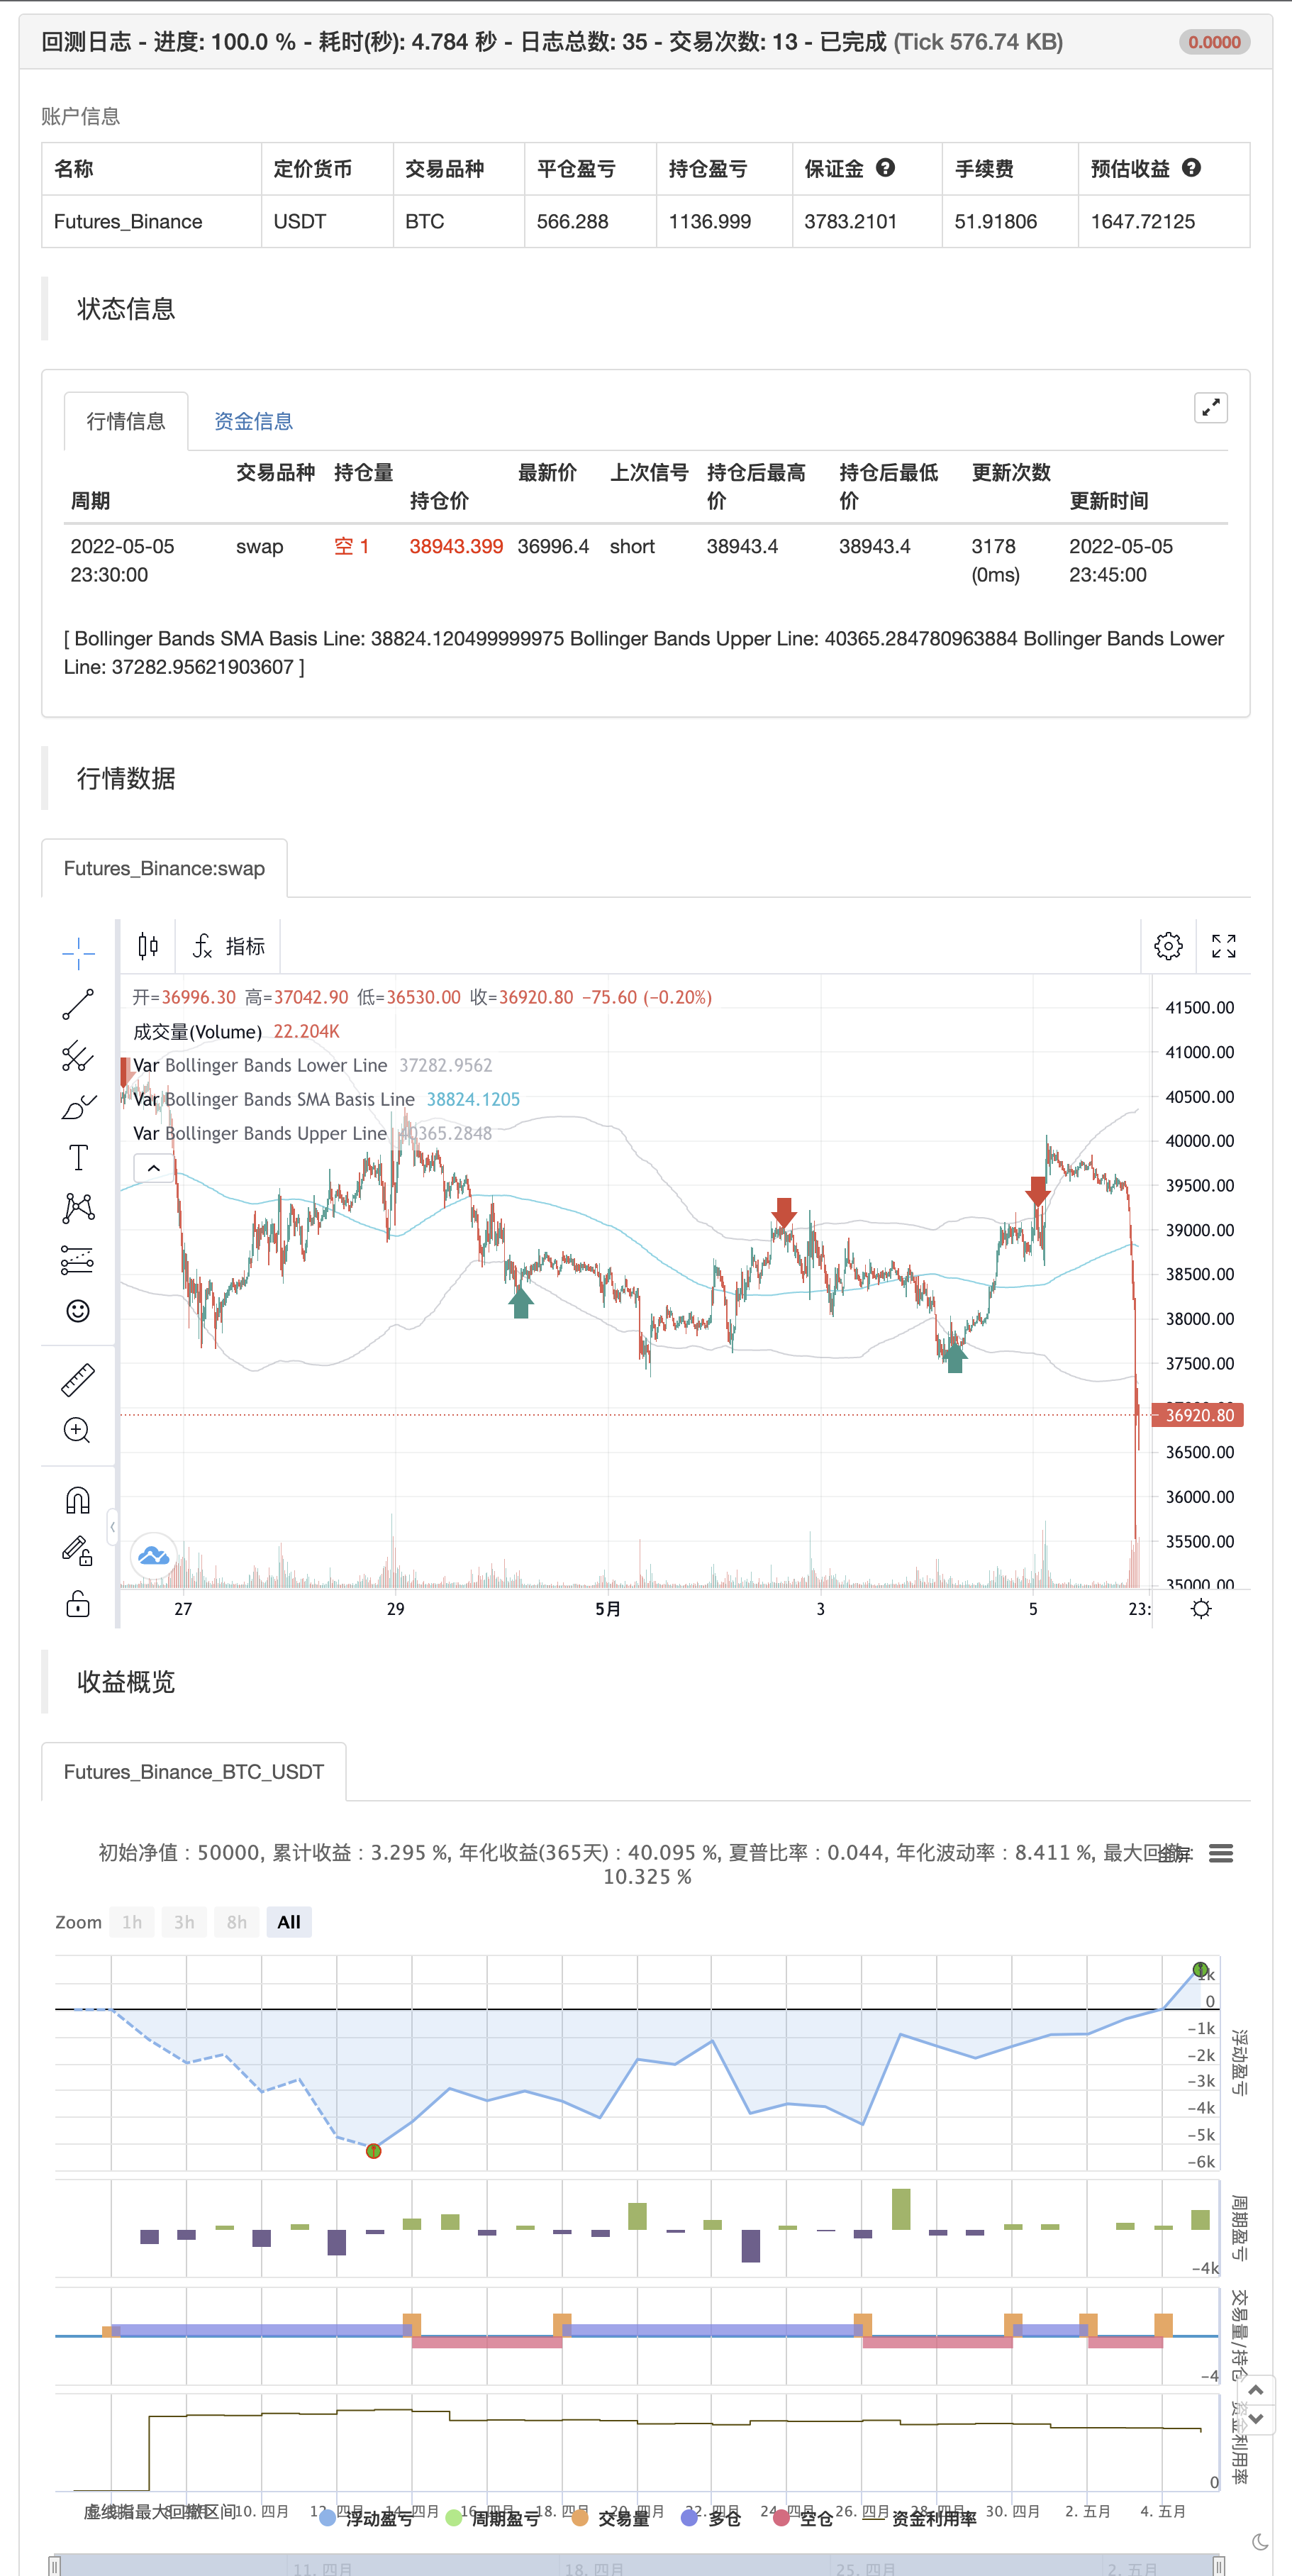
이 전략은 RSI 지표와 볼링거 밴드 (Bollinger Bands) 를 사용하여 가격이 상부 볼링거 밴드 (Bollinger Band) 이상일 때 판매하고 (이 값이 하부 밴드 (Bollinger Band) 이하일 때 구매) 합니다. 이 간단한 전략은 RSI와 볼링거 밴드 (Bollinger Band) 지표가 동시에 과잉 구매 또는 과잉 판매 상태일 때만 작동합니다.
업데이트이 업데이트 된 버전 1.1에서 전략은 사용자 (작은 입력) 를 위해 단순화되었으며 현재 볼린거 밴드의 기초가 되는 SMA를 위해 200 기간을 사용하여 백테스팅에서 더 성공했습니다. 또한 색상 알림의 수를 줄여 적은, 그러나 더 관련 거래 기회를 보여줍니다.
그리고 첫 번째 버전과 마찬가지로이 전략은 더 높은 시간 프레임에서 폐쇄 가격을 사용하지 않으며 현재 촛불이 닫힌 후 재 칠해야합니다.
모든 거래는 높은 위험을 포함합니다. 과거의 성과는 반드시 미래의 결과를 나타내는 것은 아닙니다. 가설적 또는 시뮬레이션 성과 결과는 특정 고유 한 제한을 가지고 있습니다. 실제 성과 기록과 달리 시뮬레이션 결과는 실제 거래를 대표하지 않습니다. 또한, 거래가 실제로 실행되지 않았기 때문에, 결과는 유동성 부족과 같은 특정 시장 요인의 영향을 과소 또는 과대 보상 할 수 있습니다. 일반적으로 시뮬레이션 거래 프로그램은 후견의 이익을 위해 설계되어 있다는 사실에도 종속됩니다. 어떤 계정도 표시 된 것과 유사한 이익이나 손실을 달성하거나 달성할 가능성이 있다고 표현되지 않습니다.
P.S. 고급 사용자를 위해 이 전략 스크립트의 더 많은 기능에 액세스하려면 1.0 버전을 사용하십시오:재검토
/*backtest
start: 2022-04-06 00:00:00
end: 2022-05-05 23:59:00
period: 15m
basePeriod: 5m
exchanges: [{"eid":"Futures_Binance","currency":"BTC_USDT"}]
*/

//@version=2
strategy("Bollinger + RSI, Double Strategy (by ChartArt) v1.1", shorttitle="CA_-_RSI_Bol_Strat_1.1", overlay=true)

// ChartArt's RSI + Bollinger Bands, Double Strategy - Update
//
// Version 1.1
// Idea by ChartArt on January 18, 2015.
//
// This strategy uses the RSI indicator
// together with the Bollinger Bands
// to sell when the price is above the
// upper Bollinger Band (and to buy when
// this value is below the lower band).
//
// This simple strategy only triggers when
// both the RSI and the Bollinger Bands
// indicators are at the same time in
// a overbought or oversold condition.
//
// In this version 1.1 the strategy was
// both simplified for the user and
// made more successful in backtesting.
//
// List of my work:
// https://www.tradingview.com/u/ChartArt/
//
//  __             __  ___       __  ___
// /  ` |__|  /\  |__)  |   /\  |__)  |
// \__, |  | /~~\ |  \  |  /~~\ |  \  |
//
//


///////////// RSI
RSIlength = input(6,title="RSI Period Length")
RSIoverSold = 50
RSIoverBought = 50
price = close
vrsi = rsi(price, RSIlength)


///////////// Bollinger Bands
BBlength = input(200, minval=1,title="Bollinger Period Length")
BBmult = 2 // input(2.0, minval=0.001, maxval=50,title="Bollinger Bands Standard Deviation")
BBbasis = sma(price, BBlength)
BBdev = BBmult * stdev(price, BBlength)
BBupper = BBbasis + BBdev
BBlower = BBbasis - BBdev
source = close
buyEntry = crossover(source, BBlower)
sellEntry = crossunder(source, BBupper)
plot(BBbasis, color=aqua,title="Bollinger Bands SMA Basis Line")
p1 = plot(BBupper, color=silver,title="Bollinger Bands Upper Line")
p2 = plot(BBlower, color=silver,title="Bollinger Bands Lower Line")
//fill(p1, p2)


///////////// Colors
switch1=input(true, title="Enable Bar Color?")
switch2=input(true, title="Enable Background Color?")
TrendColor = RSIoverBought and (price[1] > BBupper and price < BBupper) and BBbasis < BBbasis[1] ? red : RSIoverSold and (price[1] < BBlower and price > BBlower) and BBbasis > BBbasis[1] ? green : na
///barcolor(switch1?TrendColor:na)
//bgcolor(switch2?TrendColor:na,transp=50)


///////////// RSI + Bollinger Bands Strategy
if (not na(vrsi))

    if (crossover(vrsi, RSIoverSold) and crossover(source, BBlower))
        strategy.entry("RSI_BB_L", strategy.long, stop=BBlower,  comment="RSI_BB_L")

    if (crossunder(vrsi, RSIoverBought) and crossunder(source, BBupper))
        strategy.entry("RSI_BB_S", strategy.short, stop=BBupper,  comment="RSI_BB_S")

//plot(strategy.equity, title="equity", color=red, linewidth=2, style=areabr)
- MACD RSI 이치모쿠 모멘텀 트렌드
- RSI 방향 변경 전략
- 향상된 볼링거 밴드 RSI 거래 전략
- 중추 및 동력 전략
- 이동 평균 및 RSI 종합 거래 전략
- 토요일 전환 전략 (주말 필터)
- RSI/MACD/ATR과 함께 강화된 EMA 크로스오버 전략
- MACD와 RSI 결합된 장기 거래 전략
- RSI2 전략 내일 반전 승률 역시험
- 전략에 따른 다중 지표 트렌드
- AlphaTradingBot 거래 전략