
이 전략은 개시 가격과 고가 가격의 교차에 기초하여 거래 신호를 판단한다. 개시 가격에 고가 가격에 다다를 때 더 많이 하고, 개시 가격 아래에 고가 가격에 다다를 때 공백한다. 이동 평균을 사용하여 가격 데이터를 평형화하고, 노이즈 거래를 줄인다. 이동 평균 유형과 매개 변수를 구성할 수 있다. 또한 손실 추적을 활성화하여 이익을 잠금 할 수 있도록 구성할 수 있다.
입력 변수에 따라 대안 주기 해상도를 사용할지 여부를 결정합니다. 사용되면 stratRes에 따라 주기 설정합니다.
입력 매개 변수에 따라 이동 평균을 사용할지 여부를 결정합니다. () () () () () () () () () () () () () () () () () () () () () () () () () () () () () () () () () () () () () () () () () () () () () () () () () () () () () () () () () () () () () () () () () () () () () () () () () () () () () () () () () () () () () () () () () () () () () () () () () () () () () () () () () () () () () () () () () () () () () () () () () () () () () () () () () () () () () () () () () () () () () () () () () () () () () () () () () () () () () () () () () () () () () () () () () () () () () () () () () () () () () () () () () () () () () () () () () () () () () () () () () () () () () () () () () () () () () () () () () () () () () () () () () () () () () () () () () () () () () () ()
오픈 가격 (open) 과 클로즈 가격 (close) 의 일련의 데이터를 얻습니다. 이동 평균을 사용하는 경우, 선택된 이동 평균 유형과 매개 변수를 부드럽게 처리합니다.
현재 개시값 x와 개시값 시리즈 openSeries을 비교한다. x가 openSeries보다 크면 트렌드 상태는 trendState가 다목, 그렇지 않으면 빈목이다.
상위 가격에서 상위 가격의 이동 평균을 통과하면 다중 신호 longCond가 발생하고, 상하 가격에서 상위 가격의 이동 평균을 통과하면 하위 신호 shortCond가 발생한다
다중 코어 신호에 따라 다중 헤드 또는 빈 헤드 포지션에 들어갑니다. 추적 중지 손실이 활성화 된 경우, 중지 손실 지점 위치 및 오차 거리를 설정하십시오.
단 하나의 데이터 시리즈의 한계를 피하기 위해 상가와 고가 두 개의 다른 시리즈를 사용하여 거래 신호 판단을 수행하십시오.
이동 평균 기술을 적용하면 단기 시장 소음을 필터링하여 주요 추세를 고정 할 수 있습니다.
이동 평균 유형을 유연하게 구성하여 최적의 효과를 위해 파라미터를 조정할 수 있습니다.
리스크를 제어하고 수익을 고정하기 위해 추적 스톱을 사용할 수 있습니다.
전략 최적화 공간은 넓고, 다양한 품종과 시장 환경에 따라 변수를 조정할 수 있다.
단일 거래 신호 출처, 신호는 희귀하고, 표를 놓치기 쉽다.
이동 평균의 문제점으로 인해, 단기적인 기회를 놓칠 수 있습니다.
추적 중지 설정이 잘못되어 너무 일찍 또는 너무 많이 중지될 수 있습니다.
매개 변수 설정이 잘못되면 가상 거래가 너무 자주 발생하여 실 디스크 효과에 영향을 미칠 수 있습니다.
다른 품종과 시장 환경은 파라미터를 조정해야 하며, 최적화가 더 어렵다.
다른 지표 판단을 추가하거나 머신 러닝 모델을 도입하여 신호원을 풍부하게 할 수 있습니다. 이동 평균 유형과 파라미터를 최적의 평준화 효과를 위해 조정하십시오.
다른 기술 지표 판단을 추가하여 거래 신호를 풍부하게 합니다.
기계학습 모델을 적용하여 신호 판단을 처리한다.
이동 평균 변수를 최적화하여 최적의 변수 조합을 찾습니다.
스톱로스 트래킹을 최적화하여 스톱로스 폭과 수익을 균형 잡는다.
매개 변수 최적화 기능을 추가하여 최적의 매개 변수를 자동으로 찾습니다.
다양한 품종에 대한 독자적인 매개 변수 템플릿을 개발한다.
양적 피드백 프레임워크 개발, 빠른 반복 전략.
이 전략은 상가와 높은 가격의 교차를 기반으로 거래 신호 판단을 하고, 이동 평균 기술 필터링 소음을 사용한다. 파라미터를 유연하게 구성하여 여러 가지 효과를 달성한다. 특정 장점이 있지만, 신호의 적은 양, 지연 등과 같은 몇 가지 문제도 있다. 더 많은 지표 조합 판단, 기계 학습 방법 등을 도입하여 최적화하면 강력한 거래 전략을 형성할 수 있다.
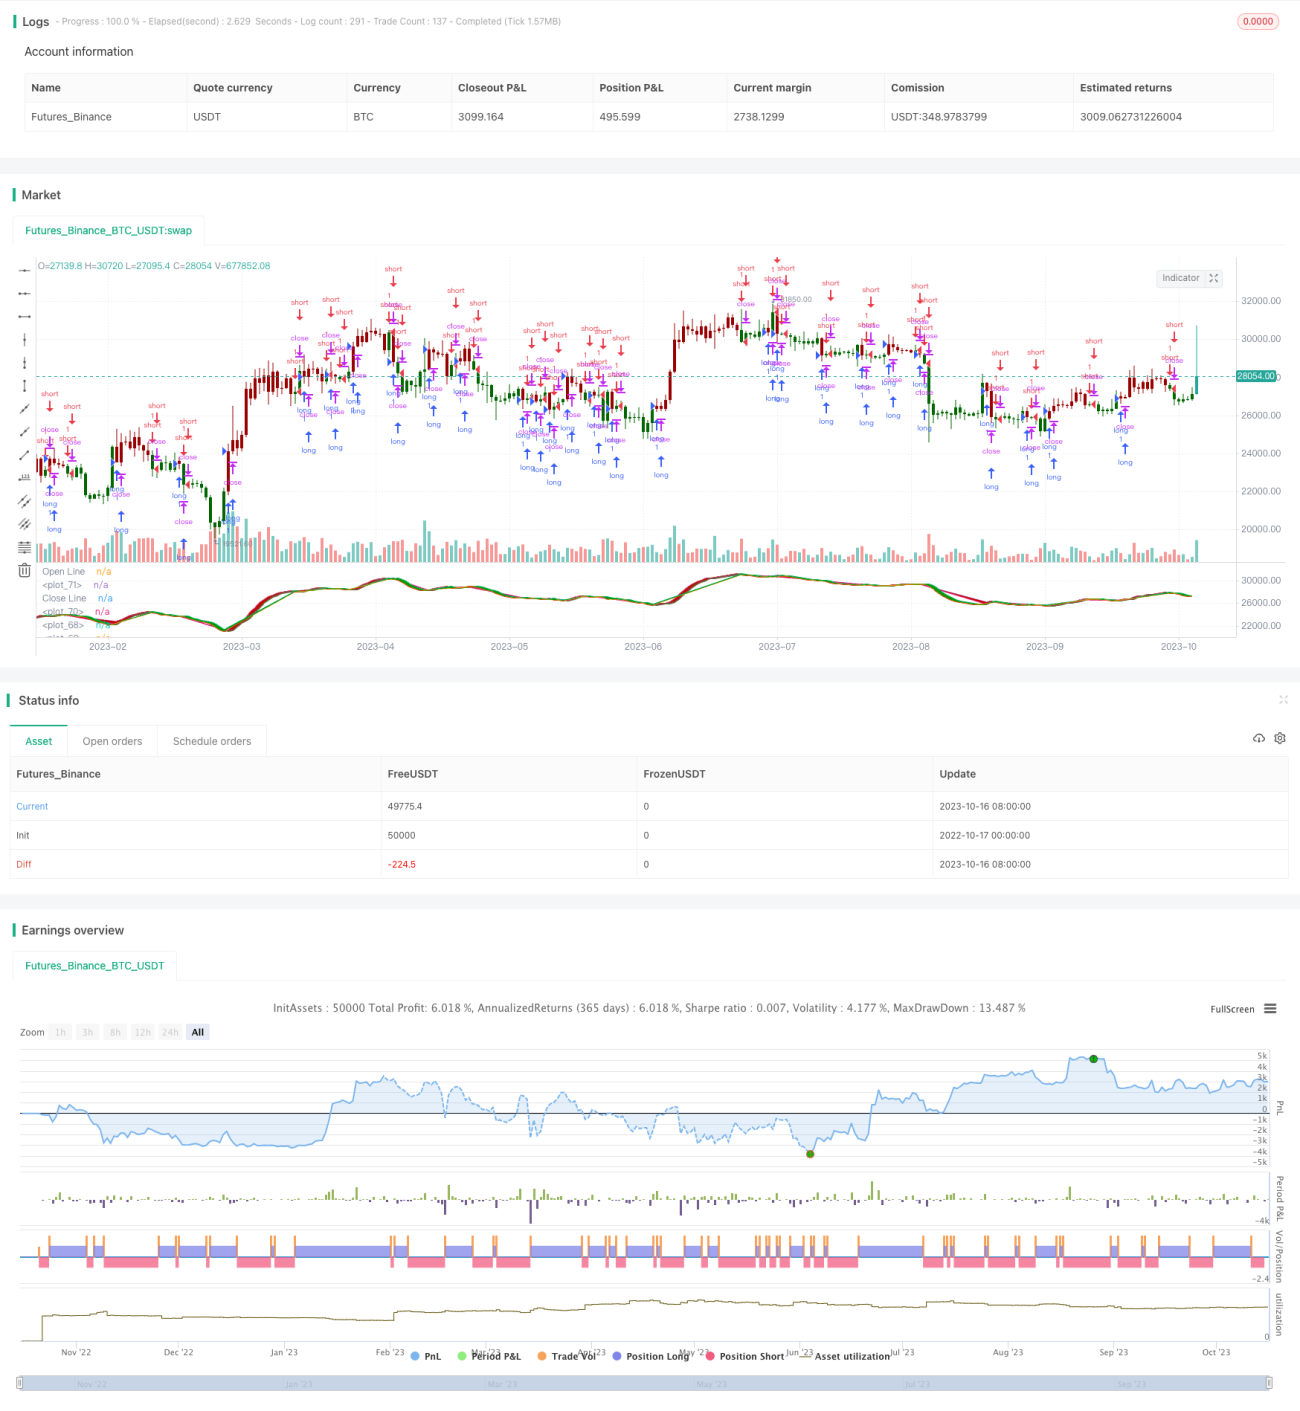
/*backtest
start: 2022-10-17 00:00:00
end: 2023-10-17 00:00:00
period: 1d
basePeriod: 1h
exchanges: [{"eid":"Futures_Binance","currency":"BTC_USDT"}]
*/
//@version=2
//strategy(title = "Open Close Cross Strategy", shorttitle = "OCC Strategy", overlay = true, pyramiding = 0, default_qty_type = strategy.percent_of_equity, default_qty_value = 10)
// Revision: 1
// Author: @JayRogers
//
// Description:
// - Strategy based around Open-Close Crossovers.
// Setup:
// - I have generally found that setting the strategy resolution to 3-4x that of the chart you are viewing
// tends to yield the best results, regardless of which MA option you may choose (if any)
// - Don't aim for perfection. Just aim to get a reasonably snug fit with the O-C band, with good runs of
// green and red.
// - Option to either use basic open and close series data, or pick your poison with a wide array of MA types.
// - Optional trailing stop for damage mitigation if desired (can be toggled on/off)
// - Positions get taken automagically following a crossover - which is why it's better to set the resolution
// of the script greater than that of your chart, so that the trades get taken sooner rather than later.
// - If you make use of the trailing stops, be sure to take your time tweaking the values. Cutting it too fine
// will cost you profits but keep you safer, while letting them loose could lead to more drawdown than you
// can handle.
// === INPUTS ===
useRes = input(defval = true, title = "Use Alternate Resolution? ( recommended )")
stratRes = input(defval = "120", title = "Set Resolution ( should not be lower than chart )")
useMA = input(defval = true, title = "Use MA? ( otherwise use simple Open/Close data )")
basisType = input(defval = "DEMA", title = "MA Type: SMA, EMA, DEMA, TEMA, WMA, VWMA, SMMA, HullMA, LSMA, ALMA ( case sensitive )")
basisLen = input(defval = 14, title = "MA Period", minval = 1)
offsetSigma = input(defval = 6, title = "Offset for LSMA / Sigma for ALMA", minval = 0)
offsetALMA = input(defval = 0.85, title = "Offset for ALMA", minval = 0, step = 0.01)
useStop = input(defval = true, title = "Use Trailing Stop?")
slPoints = input(defval = 200, title = "Stop Loss Trail Points", minval = 1)
slOffset = input(defval = 400, title = "Stop Loss Trail Offset", minval = 1)
// === /INPUTS ===
// === BASE FUNCTIONS ===
// Returns MA input selection variant, default to SMA if blank or typo.
variant(type, src, len, offSig, offALMA) =>
v1 = sma(src, len) // Simple
v2 = ema(src, len) // Exponential
v3 = 2 * v2 - ema(v2, len) // Double Exponential
v4 = 3 * (v2 - ema(v2, len)) + ema(ema(v2, len), len) // Triple Exponential
v5 = wma(src, len) // Weighted
v6 = vwma(src, len) // Volume Weighted
v7 = na(v5[1]) ? sma(src, len) : (v5[1] * (len - 1) + src) / len // Smoothed
v8 = wma(2 * wma(src, len / 2) - wma(src, len), round(sqrt(len))) // Hull
v9 = linreg(src, len, offSig) // Least Squares
v10 = alma(src, len, offALMA, offSig) // Arnaud Legoux
type=="EMA"?v2 : type=="DEMA"?v3 : type=="TEMA"?v4 : type=="WMA"?v5 : type=="VWMA"?v6 : type=="SMMA"?v7 : type=="HullMA"?v8 : type=="LSMA"?v9 : type=="ALMA"?v10 : v1
// security wrapper for repeat calls
reso(exp, use, res) => use ? request.security(syminfo.tickerid, res, exp) : exp
// === /BASE FUNCTIONS ===
// === SERIES SETUP ===
// open/close
//closeSeries = useMA ? reso(variant(basisType, close, basisLen, offsetSigma, offsetALMA), useRes, stratRes) : reso(close, useRes, stratRes)
openSeries = useMA ? reso(variant(basisType, open, basisLen, offsetSigma, offsetALMA), useRes, stratRes) : reso(open, useRes, stratRes)
x = openSeries[1]
trendState = x > openSeries ? true : x < openSeries ? false : trendState[1]
// === /SERIES ===
// === PLOTTING ===
barcolor(color = x > openSeries ? #006600 : #990000, title = "Bar Colours")
// channel outline
closePlot = plot(x, title = "Close Line", color = #009900, linewidth = 2, style = line, transp = 90)
openPlot = plot(openSeries, title = "Open Line", color = #CC0000, linewidth = 2, style = line, transp = 90)
// channel fill
closePlotU = plot(trendState ? x : na, transp = 100, editable = false)
openPlotU = plot(trendState ? openSeries : na, transp = 100, editable = false)
closePlotD = plot(trendState ? na : x, transp = 100, editable = false)
openPlotD = plot(trendState ? na : openSeries, transp = 100, editable = false)
fill(openPlotU, closePlotU, title = "Up Trend Fill", color = #009900, transp = 40)
fill(openPlotD, closePlotD, title = "Down Trend Fill", color = #CC0000, transp = 40)
// === /PLOTTING ===
// === STRATEGY ===
// conditions
longCond = crossover(openSeries, x)
shortCond = crossunder(openSeries, x)
// entries and base exit
strategy.entry("long", true, when = longCond)
strategy.entry("short", false, when = shortCond)
// if we're using the trailing stop
//if (useStop)
// strategy.exit("XL", from_entry = "long", trail_points = slPoints, trail_offset = slOffset)
// strategy.exit("XS", from_entry = "short", trail_points = slPoints, trail_offset = slOffset)
// not sure needed, but just incase..
//strategy.exit("XL", from_entry = "long", when = shortCond)
//strategy.exit("XS", from_entry = "short", when = longCond)
// === /STRATEGY ===