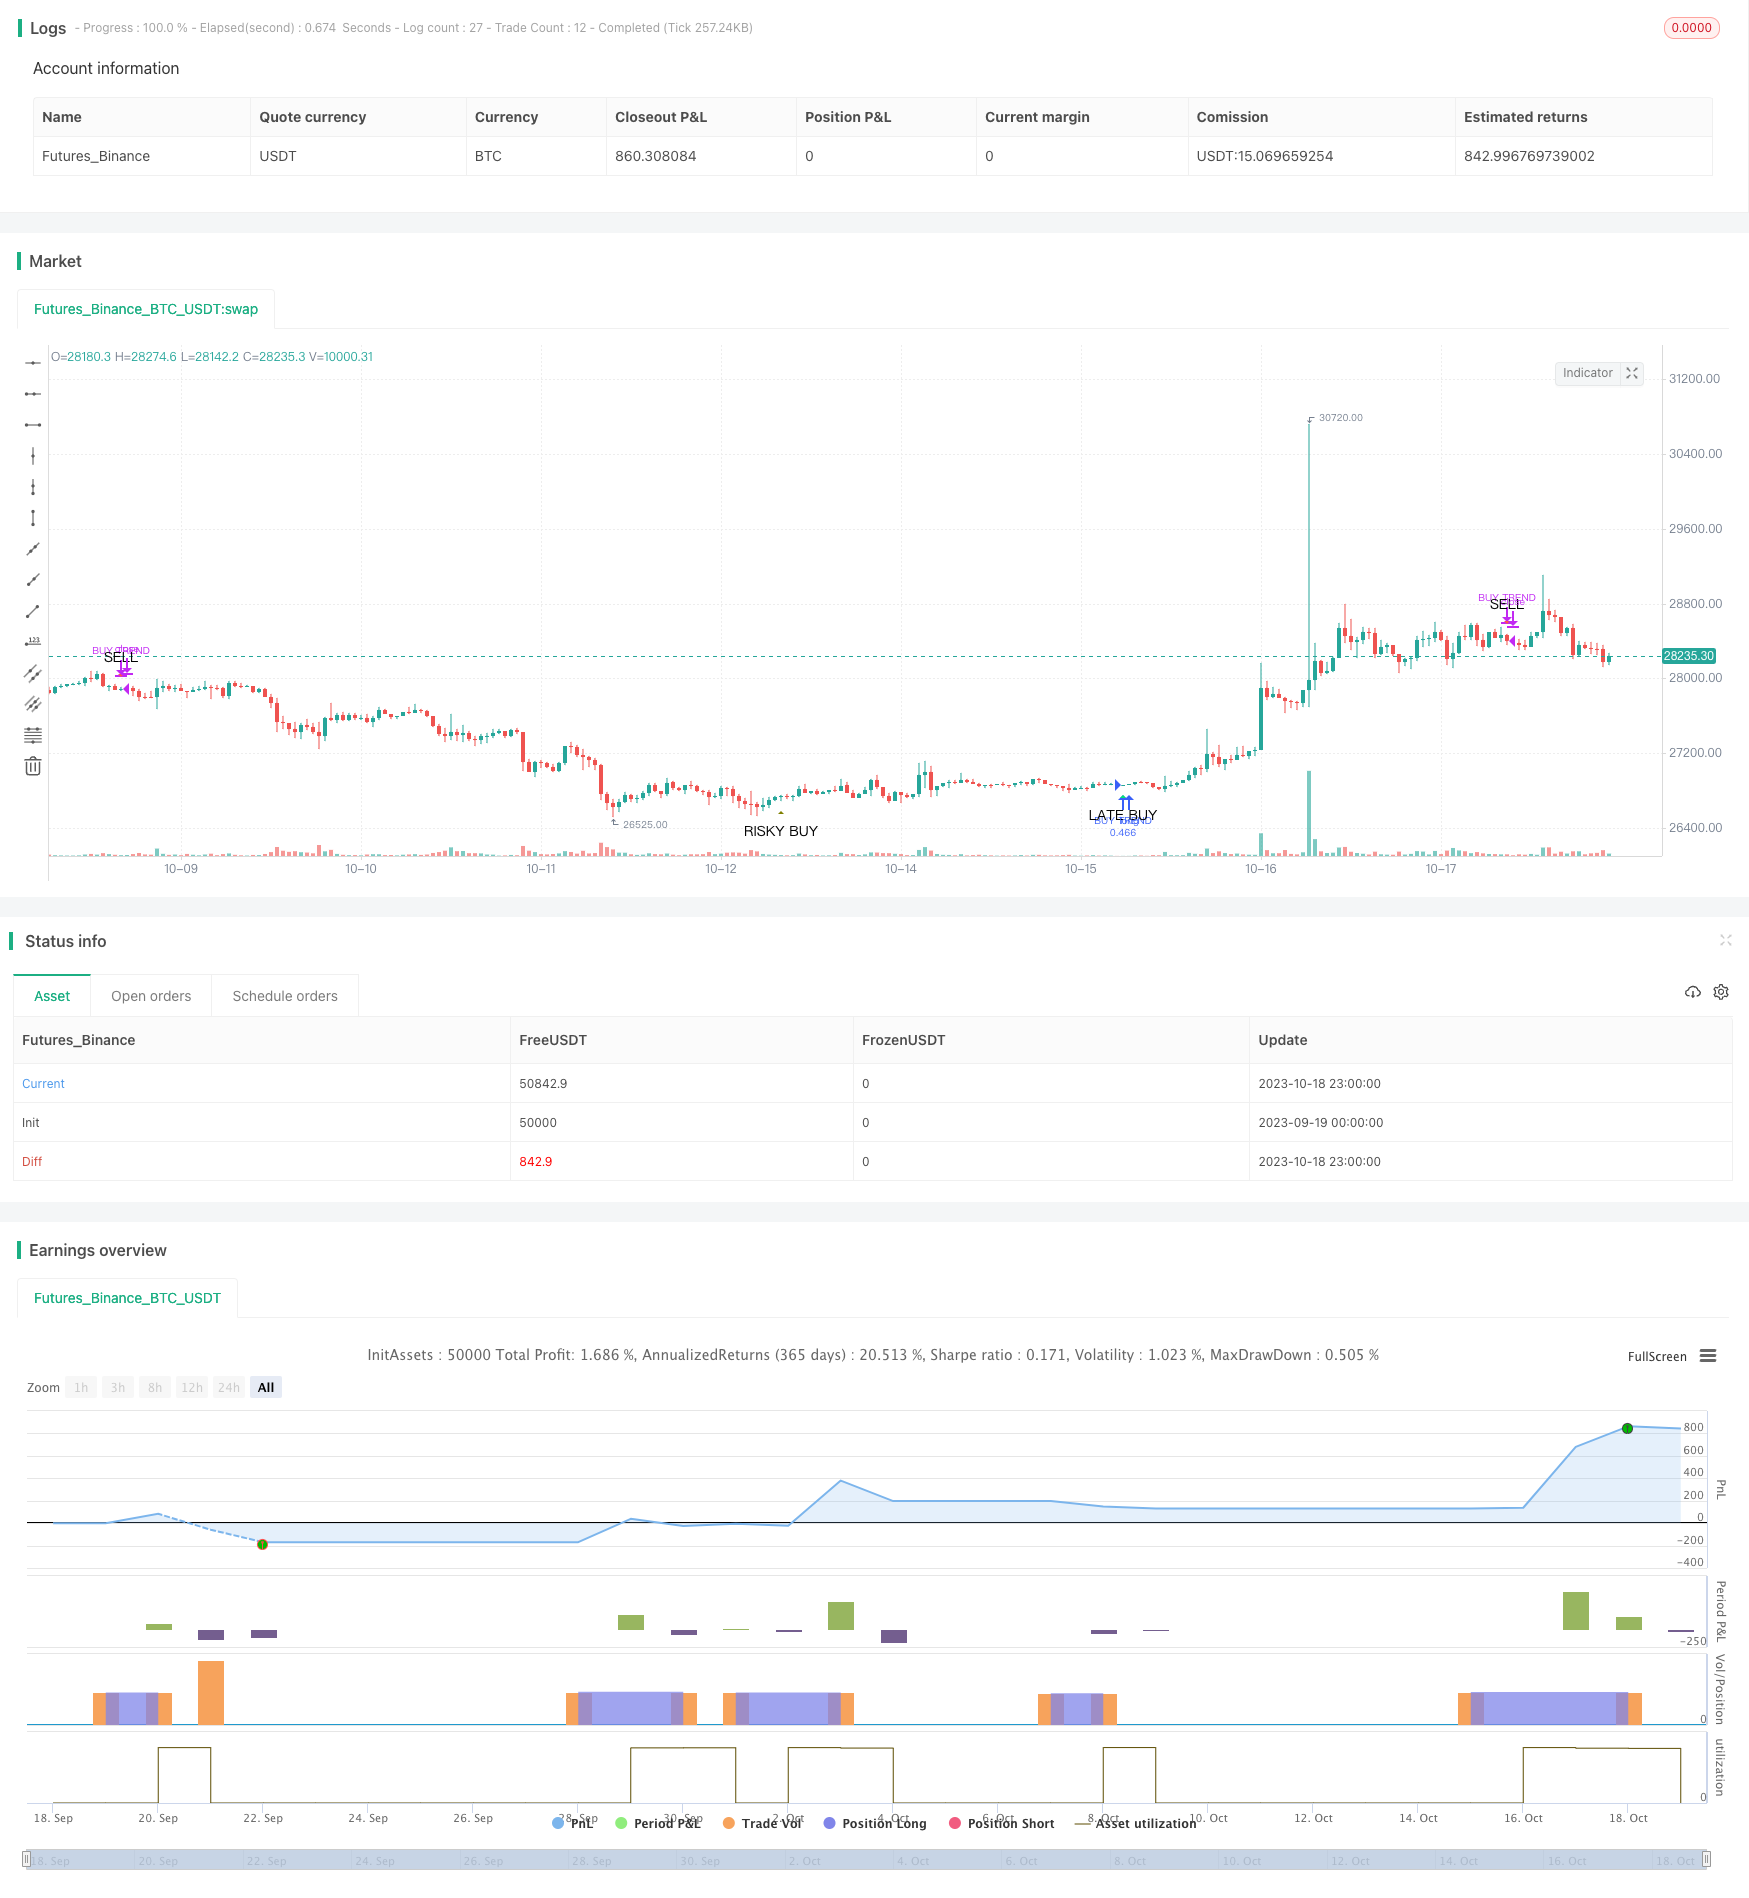
개요
이 전략은 평행선 교차를 사용하여 가격 운동 방향을 판단하고, 골드 포크 데드 포크를 사용하여 전반적인 추세를 판단하여 추세 추적을 구현한다.
전략 원칙
이 전략은 EMA와 SMA의 두 평행선의 교차를 사용하여 가격 동력의 방향을 판단합니다. EMA는 더 빨리 반응하고 SMA는 더 안정적입니다. SMA를 통과할 때 가격 상승 동력이 강하다고 판단하고 더 많이합니다.
또한, 이 전략은 빠른 주기 SMA와 느린 주기 SMA의 교차를 사용하여 전반적인 트렌드 방향을 판단한다. 빠른 SMA 상에서 느린 SMA를 통과하면 금 포크로 판단되어 거래가 장기 상승 추세에 있다고 판단하고, 빠른 SMA 아래에서 느린 SMA를 통과하면 죽은 포크로 판단되어 거래가 장기 하향 추세에 있다고 판단한다.
전략이 EMA에서 SMA를 통과할 때 더 많은 기회를 판단한다. 이 시기가 골드 포크라면, 더 많은 것이 단기 동력 지원뿐만 아니라 장기 동향과 일치한다는 것을 나타냅니다. 이것은 더 나은 시간입니다.
우위 분석
- 평균선 교차를 이용하여 가격의 움직임과 방향을 판단하는 방법
- 단기적 동력과 장기적 추세를 고려하는 동시에
- 이중 지표 확인 신호와 결합하여 신뢰성이 높습니다.
- 평균선 변수를 조정하여 다른 주기에 적응할 수 있습니다.
- 특정 거래 신호를 표시할 수 있는지 설정할 수 있으며 인터페이스는 사용자 정의 할 수 있습니다.
위험 분석
- 평균선 교차점의 지연으로 인해 최상시점을 놓칠 수 있습니다.
- 고정 주기의 SMA는 가격 변화를 실시간으로 반영할 수 없습니다.
- 긴 짧은 주기 평균선은 잘못된 교차 신호를 생성할 수 있다
- 장기적으로 재무 위험을 증가시킬 수 있는
다른 지표와 결합하여 신호를 확인하거나, 평선주기 파라미터를 최적화하거나, 스톱로스를 설정하여 위험을 줄일 수 있다.
최적화 방향
- 거래량, 브린밴드 등과 같은 다른 지표에 대한 필터를 추가합니다.
- 더 많은 손실을 막는 전략
- 평균주기 변수를 최적화
- 자금 관리 최적화
- 실시간으로 지분 비율을 조정하는 것을 고려하십시오.
요약하다
이 전략은 전반적으로 안정적이고 신뢰할 수 있는 트렌드 추적 전략이다. 단기 가격 운동과 장기 트렌드 방향을 동시에 고려하여 평평선 교차로 거래 신호를 형성한다. 단일 평평선 전략에 비해 이중 지표 확인과 결합하여 신뢰성이 높다. 그러나 트렌드 추적 전략으로서, 그것의 파라미터 최적화 및 위험 제어는 매우 중요하며, 전략의 효과를 발휘하기 위해 반복적인 테스트 조정이 필요합니다. 지속적인 최적화 및 개선으로, 이 전략은 장기적으로 보유 할 가치가있는 양화 투자의 구성 요소가 될 수 있습니다.
/*backtest
start: 2023-09-19 00:00:00
end: 2023-10-19 00:00:00
period: 1h
basePeriod: 15m
exchanges: [{"eid":"Futures_Binance","currency":"BTC_USDT"}]
*/

// This source code is subject to the terms of the Mozilla Public License 2.0 at https://mozilla.org/MPL/2.0/
// © Cryptoluc1d

//@version=4
strategy("Equal-Length EMA/SMA Crossover Strategy", initial_capital=10000, default_qty_type=strategy.percent_of_equity, default_qty_value=25, commission_type=strategy.commission.percent, commission_value=0.2, overlay=true)

// Create inputs

mom_length = input(title="Momentum Length (EMA=SMA)", defval=50)
bias_length_fast  = input(title="Golden Cross Length (Fast)", defval=50)
bias_length_slow  = input(title="Golden Cross Length (Slow)", defval=100)

// Define MAs

ema = ema(close, mom_length) // EMA/SMA crossover of the same period for detecting trend acceleration/deceleration
sma = sma(close, mom_length)
bias_fast = sma(close, bias_length_fast) // golden/death cross for overall trend bias
bias_slow = sma(close, bias_length_slow)

// Define signal conditions

buy_trend = crossover(ema, sma) and bias_fast >= bias_slow // buy when EMA cross above SMA. if this happens during a bullish golden cross, buying is in confluence with the overall trend (bias).
buy_risky = crossover(ema, sma) and bias_fast < bias_slow // buy when EMA cross above SMA. if this happens during a bearish death cross, buying is early, more risky, and not in confluence with the overall trend (bias).
buy_late = crossover(sma, bias_slow) and ema > sma // the SMA crossing the Slow_SMA gives further confirmation of bullish trend, but signal comes later.
sell = crossunder(ema, sma) // sell when EMA cross under SMA.

// Enable option to hide signals, then plot signals

show_signal = input(title="Show Signals", defval=true)

plotshape(show_signal ? buy_trend : na, title='Trend Buy', style=shape.triangleup, location=location.belowbar, color=color.green, text='TREND BUY')
plotshape(show_signal ? buy_risky : na, title='Risky Buy', style=shape.triangleup, location=location.belowbar, color=color.olive, text='RISKY BUY')
plotshape(show_signal ? buy_late : na, title='Late Buy', style=shape.triangleup, location=location.belowbar, color=color.lime, text='LATE BUY')
plotshape(show_signal ? sell : na, title='Sell', style=shape.triangledown, location=location.abovebar, color=color.red, text='SELL')

// Define entry and exit conditions

longCondition = ema > sma and bias_fast >= bias_slow // LONG when EMA above SMA, and overall trend bias is bullish
if (longCondition)
    strategy.entry("BUY TREND", strategy.long)
exitLong = crossunder(ema, sma) // close LONG when EMA cross under SMA
strategy.close("BUY TREND", when=exitLong)

// // short conditions. turned off because up only.
// shortCondition = ema < sma and bias_fast <= bias_slow // SHORT when EMA under SMA, and overall trend bias is bearish
// if (shortCondition)
//     strategy.entry("SELL TREND", strategy.short)
// exitShort = crossover(ema, sma) // close SHORT when EMA cross over SMA
// strategy.close("SELL TREND", when=exitShort)

// Enable option to show MAs, then plot MAs

show_ma = input(title="Show MAs", defval=false)

plot(show_ma ? ema : na, title="Momentum EMA", color=color.green, linewidth=1)
plot(show_ma ? sma : na, title="Momentum SMA", color=color.yellow, linewidth=1)
plot(show_ma ? bias_fast : na, title="Golden Cross SMA (Fast)", color=color.orange, linewidth=2)
plot(show_ma ? bias_slow : na, title="Golden Cross SMA (Slow)", color=color.red, linewidth=2)