누적 브레이크아웃 트레이딩 전략


생성 날짜: 2023-10-25 17:34:41 마지막으로 수정됨: 2023-10-25 17:34:41
복사: 1 클릭수: 739
avatar of ChaoZhang ChaoZhang
1
집중하다
1617
수행원

누적 브레이크아웃 트레이딩 전략

개요

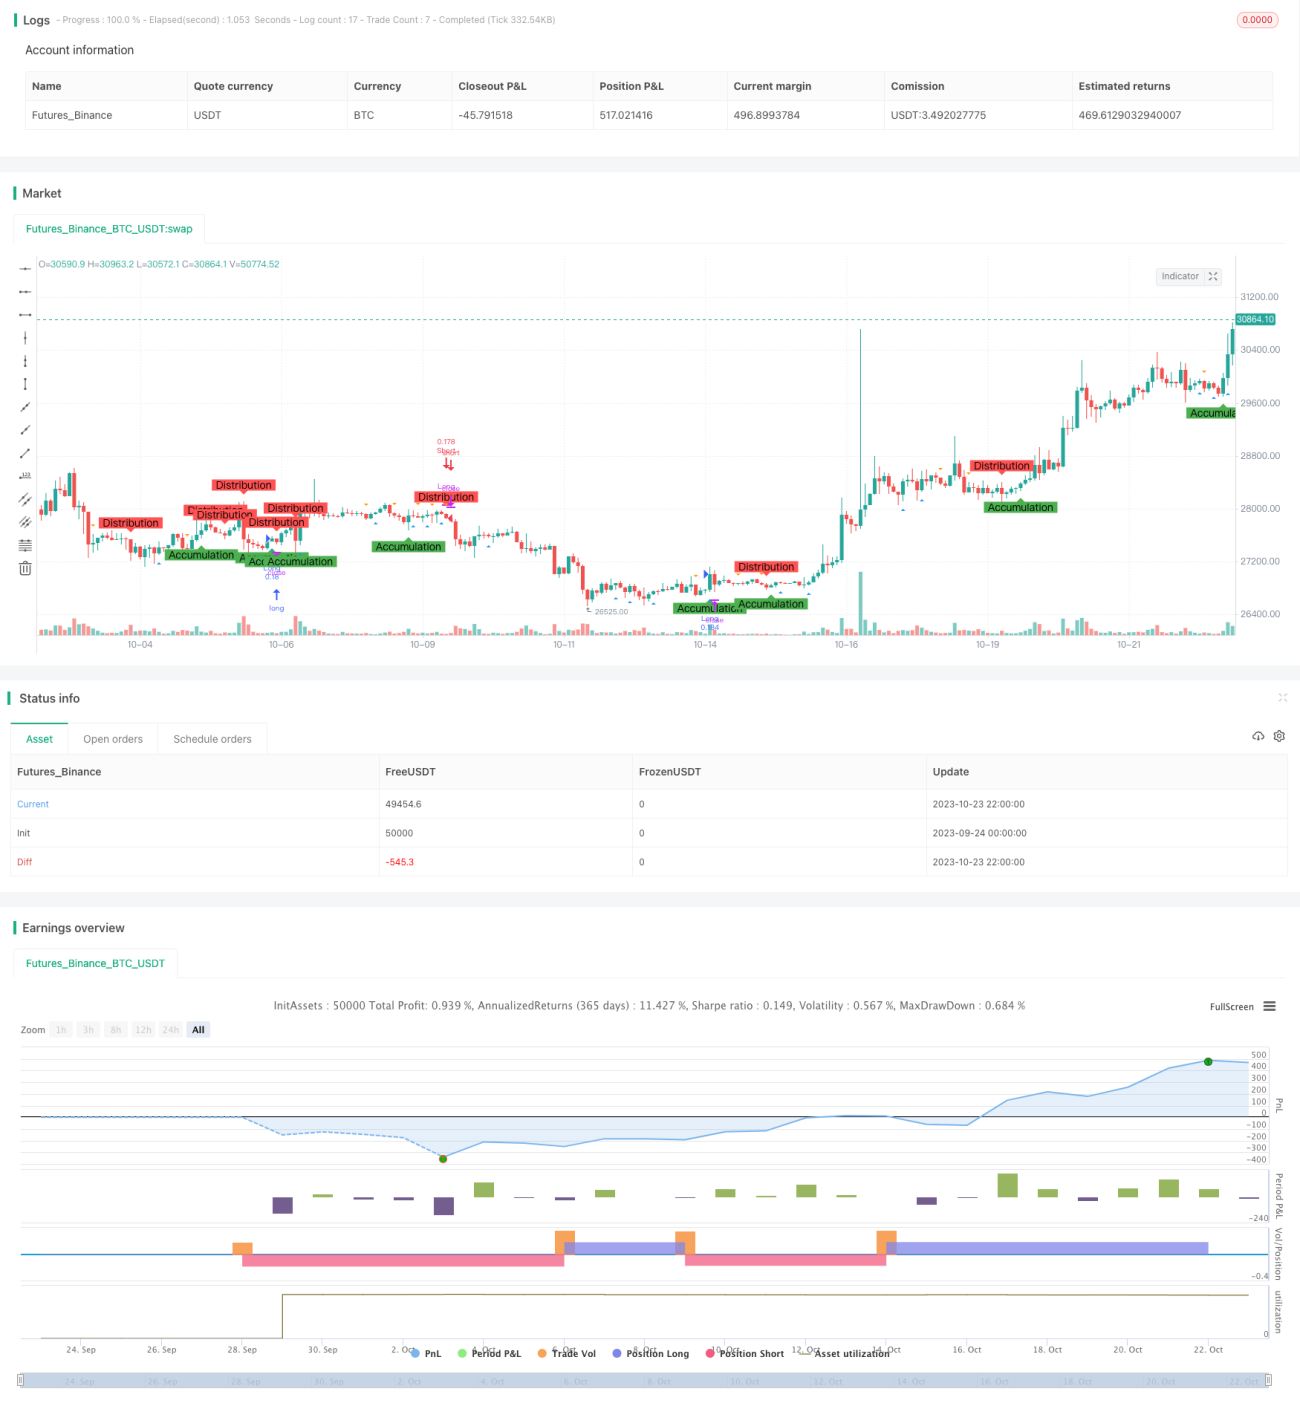
점진적 돌파 거래 전략은 시장의 점진적 및 분배 단계를 식별하여, 벡터 분석 원칙을 적용하여, 탄도형과 역동형의 판단에 보조하여, 잠재적인 구매 및 판매 기회를 찾습니다.

전략 원칙

  1. 서로 다른 길이의 평균선 교차를 사용하여 점진과 분배 단계를 식별한다. 폐가격에 길이가 AccumulationLength의 평균선으로 통과하면 점진 단계로 판단한다. 폐가격 아래에 길이가 DistributionLength의 평균선으로 통과하면 분배 단계로 판단한다.

  2. 다양한 길이의 평선 교차를 사용하여 탄도 활 모양과 반전 형태를 식별한다. 낮은 지점에서 길이 SpringLength의 평선이 통과하면 탄도 활 모양으로 판단하고 높은 지점 아래 길이 UpthrustLength의 평선이 통과하면 반전 형태로 판단한다.

  3. 점진단계에서는 弹弓形状을 관찰할 때, 더 많이 하고; 분배단계에서는 반전形状을 관찰할 때, 공백을 한다.

  4. 스톱로스 레벨을 설정한다. 긴 포지션 스톱로스 가격이 종점 가격으로 ((1 - 스톱로스 비율%), 짧은 포지션 스톱로스 가격이 종점 가격으로 ((1 + 스톱로스 비율%)) 를 설정한다.

  5. 그래프에 점진단계, 분배단계, 사격형태와 반전형태를 표기하여 형태를 식별할 수 있다.

우위 분석

  1. 빅토리 분석 방법을 사용하여 시장의 축적과 분배 단계를 식별하여 거래 신호의 신뢰도를 높일 수 있습니다.

  2. 탄도형과 반전형의 결합으로 거래하는 것은 거래 신호를 더욱 검증할 수 있다.

  3. 단독 손실을 효율적으로 제어할 수 있는 스톱 손실을 설정한다.

  4. 도표에 표기하면 전력 형성 과정이 명확하게 관찰될 수 있다.

  5. 이 전략의 매개 변수는 조정할 수 있으며, 다른 시장과 거래 사이클에 대해 최적화할 수 있다.

위험 분석

  1. 포괄적 인 경우 평균 선 신호가 잘못된 신호를 보낼 수 있습니다.

  2. 弹弓 형태와 반전 형태는 무효가 될 수 있다.

  3. 스톱 손실이 넘어가면 손실이 증가할 수 있습니다.

  4. 다른 시장에 맞게 파라미터를 조정할 필요가 있으며, 부적절하면 거래 신호 오류가 발생할 수 있다.

  5. 기계 거래 시스템은 거리로 돌아오는 시간에는 유연성이 부족할 수 있으며, 수동적인 감시가 필요할 수 있습니다.

최적화 방향

  1. 다양한 시장에서 다양한 주기에서 최적의 조합을 테스트할 수 있다.

  2. 거래 신호를 확인하기 위해 거래량 요소를 추가하는 것을 고려할 수 있다.

  3. 동적 스톱로드를 설정할 수 있으며, 시장의 변동에 따라 스톱로드 레벨을 조정할 수 있다.

  4. 중요한 시기에 잘못된 거래가 발생하지 않도록 기본 요소를 추가하는 것을 고려할 수 있습니다.

  5. 기계 학습 알고리즘에 동적으로 최적화 변수를 추가할 수 있다.

요약하다

점진적 돌파 거래 전략은 빅토리 분석, 평균 지표, 형태 인식 등 여러 가지 기술 분석 방법을 통합하여 시장의 힘을 효과적으로 식별하고 거래 신호를 생성 할 수 있습니다. 이 전략은 신뢰할 수있는 거래 신호, 제어 가능한 위험, 명확한 시각적 표시 등의 장점을 가지고 있습니다. 그러나 기계 거래 시스템으로서, 회수 시간 및 파라미터 적응성은 개선되어야합니다.

전략 소스 코드
/*backtest
start: 2023-09-24 00:00:00
end: 2023-10-24 00:00:00
period: 2h
basePeriod: 15m
exchanges: [{"eid":"Futures_Binance","currency":"BTC_USDT"}]
*/

// This source code is subject to the terms of the Mozilla Public License 2.0 at https://mozilla.org/MPL/2.0/
// © deperp

//@version=5
strategy("Wyckoff Range Strategy",  overlay=true, initial_capital=1000, default_qty_type=strategy.percent_of_equity, default_qty_value=10, commission_type=strategy.commission.percent)

// Input Variables
AccumulationLength = input(32, "Accumulation")
DistributionLength = input(35, "Distribution")
SpringLength = input(10, "Spring")
UpthrustLength = input(20, "Upthrust")
stopPercentage = input(10, "Stop Percentage")

// Accumulation Phase
isAccumulation = ta.crossover(close, ta.sma(close, AccumulationLength))

// Distribution Phase
isDistribution = ta.crossunder(close, ta.sma(close, DistributionLength))

// Spring and Upthrust
isSpring = ta.crossover(low, ta.sma(low, SpringLength))
isUpthrust = ta.crossunder(high, ta.sma(high, UpthrustLength))

// Strategy Conditions
enterLong = isAccumulation and isSpring
exitLong = isDistribution and isUpthrust

enterShort = isDistribution and isUpthrust
exitShort = isAccumulation and isSpring

// Entry and Exit Conditions
if (enterLong)
    strategy.entry("Long", strategy.long)
    
if (exitLong)
    strategy.close("Long")

if (enterShort)
    strategy.entry("Short", strategy.short)

if (exitShort)
    strategy.close("Short")

// Stop Loss
stopLossLevelLong = close * (1 - stopPercentage / 100)
stopLossLevelShort = close * (1 + stopPercentage / 100)
strategy.exit("Stop Loss Long", "Long", stop=stopLossLevelLong)
strategy.exit("Stop Loss Short", "Short", stop=stopLossLevelShort)

// Plotting Wyckoff Schematics
plotshape(isAccumulation, title="Accumulation Phase", location=location.belowbar, color=color.green, style=shape.labelup, text="Accumulation")
plotshape(isDistribution, title="Distribution Phase", location=location.abovebar, color=color.red, style=shape.labeldown, text="Distribution")
plotshape(isSpring, title="Spring", location=location.belowbar, color=color.blue, style=shape.triangleup)
plotshape(isUpthrust, title="Upthrust", location=location.abovebar, color=color.orange, style=shape.triangledown)