1-3-1 레드 및 그린 K-라인 반전 전략

개요
1-3-1 빨간색 K선 반전 전략은 K선 모양에 따라 매매 신호를 판단하는 전략이다. 이 전략은 1개의 빨간색 K선이 3개의 녹색 K선으로 반전되는지 관찰함으로써 매매 기회를 찾는다.
원칙
이 전략의 핵심 논리는 다음과 같습니다.
- 현재 K 선이 빨간 K 선인 경우를 판단합니다. 즉, 상장 가격이 상장 가격보다 낮습니다.
- 3개의 K선들이 모두 녹색 K선인지 판단하기 전에, 즉, 상장 가격이 상장 가격보다 높을 경우
- 마지막 1개의 녹색 K 선의 매장값이 첫 2개의 녹색 K 선보다 높는지 판단합니다.
- 위의 조건이 충족되면 빨간 K 선이 종료될 때 시장 가격으로 구매합니다.
- 그리고 그 값은 빨간 K 선의 최저값으로 설정됩니다.
- 정지값은 입시 가격과 입시 가격에서 정지 가격까지의 거리를 더한 값으로 설정합니다.
이 전략으로 우리는 빨간 K선이 반전된 상태에서 구매할 수 있는데, 그 후의 트렌드가 상승할 가능성이 높기 때문입니다. 동시에 위험을 통제하고 수익을 잠금하기 위해 스톱 & 스톱을 설정할 수 있습니다.
우위 분석
1-3-1 빨간색 녹색 K선 역전 전략은 다음과 같은 장점이 있다:
- 전략 논리는 간단하고 명확하며 이해하기 쉽고 구현하기 쉽습니다.
- 어떤 지표에도 의존하지 않고 K선 형태 특성을 활용하여 과잉 최적화로 인해 발생하는 문제를 피합니다.
- 입출장 규칙이 명확하고, 객관적으로 실행될 수 있습니다.
- 스톱로스와 스톱<unk>을 설정하여 각 거래의 리스크/이익 비율을 제어할 수 있습니다.
- 재검토 결과가 좋으며, 실디 디스크 조정 가능성이 강하다.
위험 분석
이 전략에는 몇 가지 위험도 있습니다.
- K선형은 100%의 미래 추세를 예측할 수 없으며, 약간의 불확실성이 존재합니다.
- 한 번만 구매하면 개인 주식의 특수성 때문에 승률이 낮아질 수 있다.
- 대시장 동향을 고려하지 않고, 대시장이 계속 하락할 때 더 큰 위험을 감수한다.
- 트레이딩 비용과 슬라이드 포인트가 설정되지 않은 상태에서는 실디 효과가 떨어질 수 있습니다.
대책:
- 평균선과 같은 지표 필터링 신호를 고려하여 구매 성공률을 높일 수 있습니다.
- 창고 관리 조정, 창고 건설
- 대장 상황에 따라 스톱로스 포지션을 동적으로 조정하거나 거래를 중지
- 다른 스톱 스톱 비율 설정을 테스트합니다.
- 거래비용을 추가한 실디 효과를 테스트
최적화 방향
이 전략은 다음과 같은 부분에서 최적화될 수 있습니다.
-
대시장 지수를 기반으로 한 필터링. 대시장의 단기 및 중기 추세에 따라 거래 신호를 필터링 할 수 있으며, 대시장이 상승 할 때 구매하고 대시장이 떨어질 때 거래를 중단 할 수 있습니다.
-
거래량 확인을 고려한다. 녹색 K 라인 거래량에 대한 판단을 높여서 거래량이 크게 될 때만 구매한다.
-
스톱 스톱 비율을 최적화한다. 다양한 스톱 스톱 비율을 테스트하여 최적의 변수 조합을 찾을 수 있다. 또한 동적 스톱 또는 이동 스톱을 설정할 수 있다.
-
포지션 관리 최적화. 포지션을 세분화하여 조건이 충족되면 포지션을 추가하여 단일 거래의 위험을 줄일 수 있습니다.
-
더 많은 필터링 조건을 추가하십시오. 예를 들어, 평균선, 변동률과 같은 지표를 고려하여 추세가 더 명확할 때 구매하십시오.
-
빅데이터 훈련은 최적의 변수를 찾는 것이다. 많은 양의 역사 데이터를 수집하고, 기계 학습과 같은 기술을 사용하여 최적의 변수 <unk>값을 훈련한다.
요약하다
1-3-1 K선 역전 전략은 전체적으로 간단하고 실용적인 단선 거래 전략이다. 명확한 입출장 규칙이 있고, 재측정 효과가 좋다. 우리는 몇 가지 최적화 조치를 통해 실장 효과를 향상시킬 수 있으며, 신뢰할 수 있는 양적 거래 전략이 된다. 또한 위험 통제에 주의를 기울이고, 재산을 적절히 관리해야 한다.
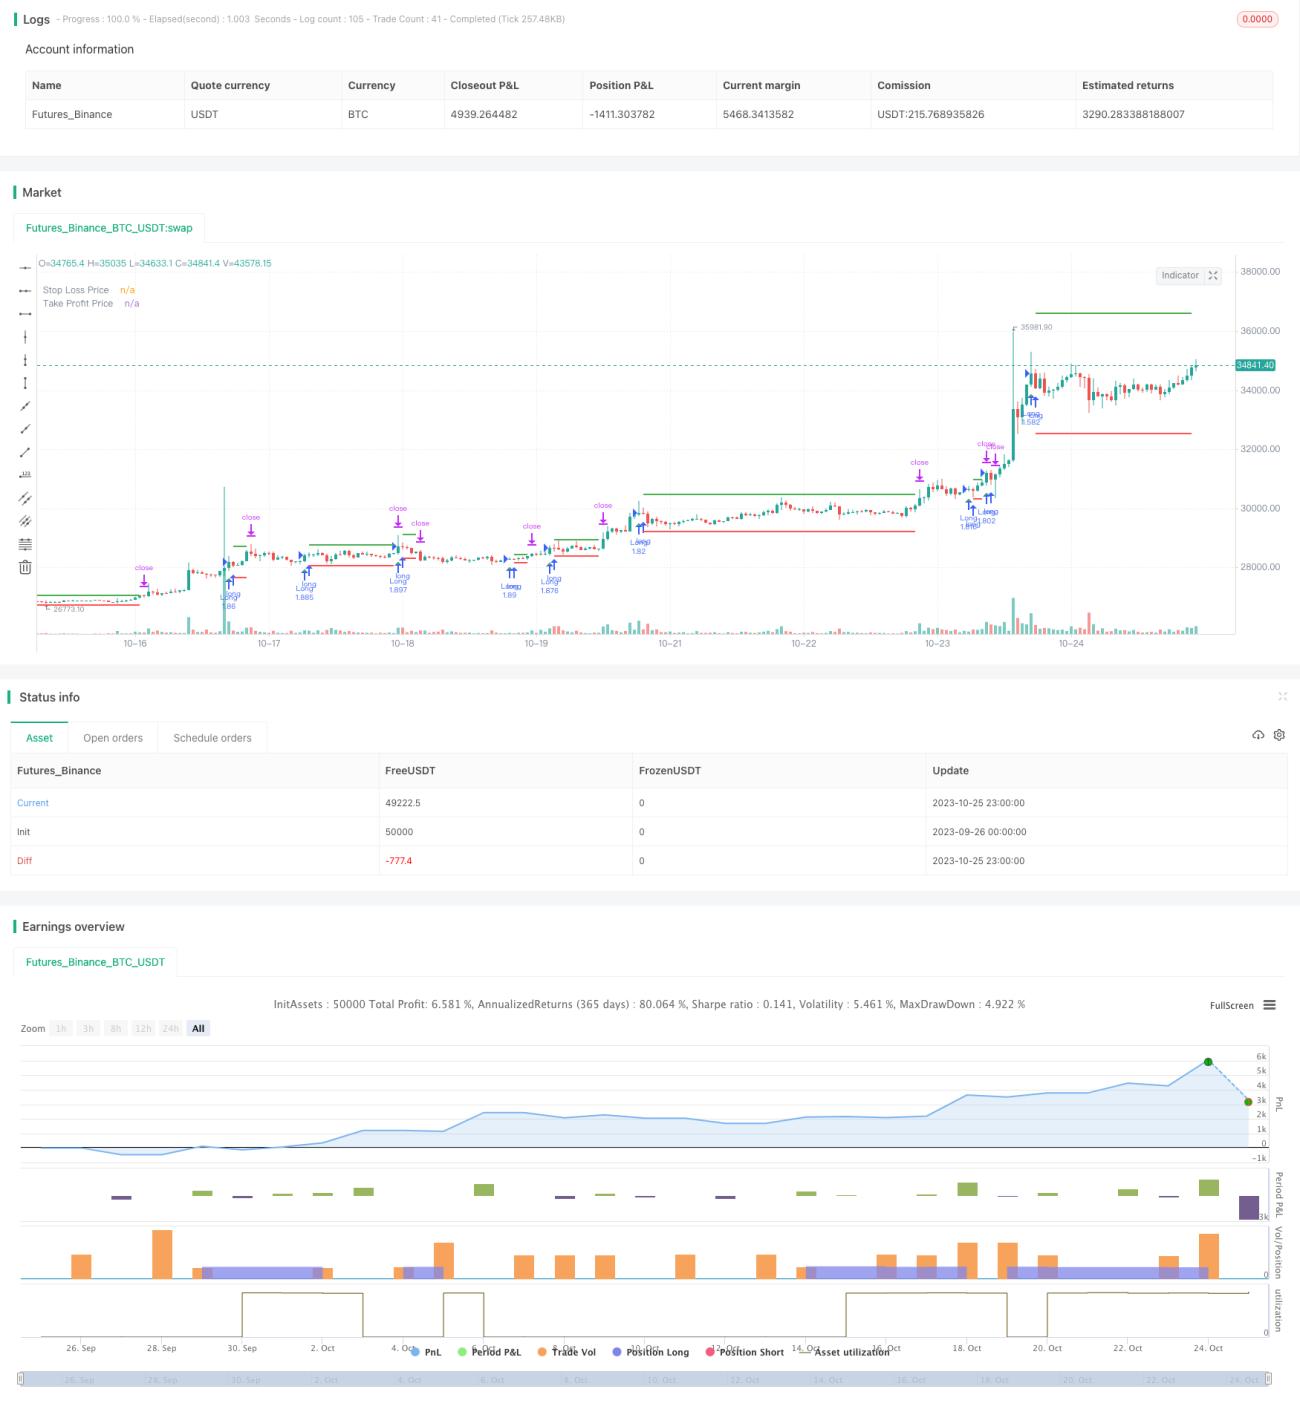
/*backtest
start: 2023-09-26 00:00:00
end: 2023-10-26 00:00:00
period: 1h
basePeriod: 15m
exchanges: [{"eid":"Futures_Binance","currency":"BTC_USDT"}]
*/

//@version=5
//by Genma01
strategy("Stratégie tradosaure 1 Bougie Rouge suivi de 3 Bougies Vertes", overlay=true, default_qty_type = strategy.percent_of_equity,  default_qty_value = 100)
- 1