
사자 균열 균형 전략은 평행선 교차에 기반한 간단한 짧은 라인 거래 전략이다. 이 전략은 주로 두 개의 이동 평균을 사용하며, 빠른 이동 평균이 아래에서 느린 이동 평균을 통과하면 더 많이 한다. 빠른 이동 평균이 위에서 느린 이동 평균을 통과하면 평행한다. 전략 이름은 거래계에서 인기있는 사자 균열 용어에서 따왔다.
이 전략은 두 개의 이동 평균을 사용한다: 빠른 이동 평균 작은 MAPeriod과 느린 이동 평균 bigMAPeriod. 두 개의 이동 평균은 가격 통로를 구성하며, 통로를 따라 빠른 이동 평균을 따라, 통로를 따라 느린 이동 평균을 따라한다. 가격이 아래에서 위쪽으로 빠른 이동 평균을 따라 아래로 돌파 할 때, 더 많이하고, 가격이 위에서 아래로 떨어질 때 천천히 이동 평균을 따라 아래로 돌파 할 때, 평점.
구체적으로, 전략은 먼저 빠른 이동 평균 (smallMA) 과 느린 이동 평균 (bigMA) 을 계산한다. 그리고는 느린 이동 평균의 ((100-percentBelowToBuy) %) 인 채널 아래의 구매 라인 (buyMA) 을 계산한다. 빠른 이동 평균 (smallMA) 이 구매 라인 (buyMA) 을 아래쪽으로 가로질러 왔을 때, 더 많이; 1%의 수익이 있거나 수익이 없으나 7K 라인을 보유한 후에, 평형.
종합적으로, 이 전략은 평행선의 ?? 사자 균열을 포착한다. 즉, 통로 아래쪽을 뚫고 단선 수익을 얻기 위한 기회이다. 그것은 동시에 단편 거래의 위험을 제어하기 위해 중지 및 중지 조건을 설정한다.
이 전략은 다음과 같은 장점을 가지고 있습니다.
개념은 간단하고 이해하기 쉽고 구현할 수 있다. 쌍평선 교차를 사용하는 것은 가장 기본적인 기술 지표 전략이다.
회귀가 쉽다. 이 전략은 TradingView 내장 회귀 기능을 직접 사용하며 추가 구현이 필요하지 않습니다.
시각화가 강하다. TradingView를 사용하면 거래 신호 포인트와 회귀 통계를 차트에 직접 표시할 수 있다.
위험 통제 가능 ᆞ 전략은 단편 거래의 손실을 효과적으로 제어할 수 있는 스톱 및 스톱 손실 조건을 설정한다.
유연한 조정. 사용자는 자신의 필요에 따라 평균선 변수와 다른 기술 지표를 조정할 수 있으며, 이는 전략이 다른 품종과 거래 스타일에 더 적합하도록합니다.
이 전략에는 다음과 같은 위험도 있습니다.
너무 많은 신호가 발생할 수 있다. 쌍평선 전략은 조립할 때 여러 번 오작동 신호가 발생할 수 있다.
단일 지표 의존. 평평선 교차만을 사용하여 의사결정을 하고, 다른 요소를 무시하면, 신호 품질이 떨어질 수 있다.
매개 변수 최적화 난이도가 높다. 평균선 주기 매개 변수 조합을 최적화하려면 많은 계산이 필요하며 최적의 매개 변수를 찾는 것은 쉽지 않다.
회수 편차. 간단한 쌍평선 전략 회수 효과는 실디보다 우수하다.
상쇄의 어려움. 고정 상쇄 지점을 설정하는 것은 상습의 변화에 적응하기 어렵다.
이 전략은 다음과 같은 측면에서 최적화될 수 있습니다.
거래량, 변동률 등과 같은 다른 지표 필터 신호와 결합하여 조정에 유효하지 않은 신호를 발생하지 않도록하십시오.
트렌드 기반 판단을 추가하여 역전 거래를 피한다. 더 긴 주기 평균선 판단 트렌드 방향을 추가할 수 있다.
기계 학습을 사용하여 최적의 변수를 찾습니다. 순차 변수 최적화 또는 유전 알고리즘을 사용하여 최적의 변수 조합을 자동으로 찾습니다.
트레이킹 스톱, 이동 스톱과 같은 스톱 전략을 추가하여 스톱을 더 유연하게 만듭니다.
입학 시점을 최적화하십시오. 다른 지표는 더 효과적인 입학 시점을 식별 할 수 있습니다.
양적 연구와 함께 파라미터 조합에 대한 피드백을 최적화하여 안정성을 높인다.
자동 거래 시스템을 개발하고, 프로그램화된 거래를 사용하여 파라미터 조합 최적화 및 전략 평가를 수행한다.
사자 틈 균형 전략은 초보자 학습에 매우 적합한 입문 전략이다. 그것은 간단한 쌍평선 교차 원리를 적용하고, 스톱 스톱 로스 규칙을 설정하여, 짧은 라인 가격 변동을 포착할 수 있다. 이 전략은 이해하기 쉬운 구현이며, 좋은 리테크 효과를 가지고 있다. 그러나, 그 최적화 난이도가 크며, 실장 효과는 의심스럽다. 우리는 다른 기술 지표, 최적화 매개 변수 및 자동화 거래 시스템 개발 등의 방법으로 이 전략을 개선할 수 있다.
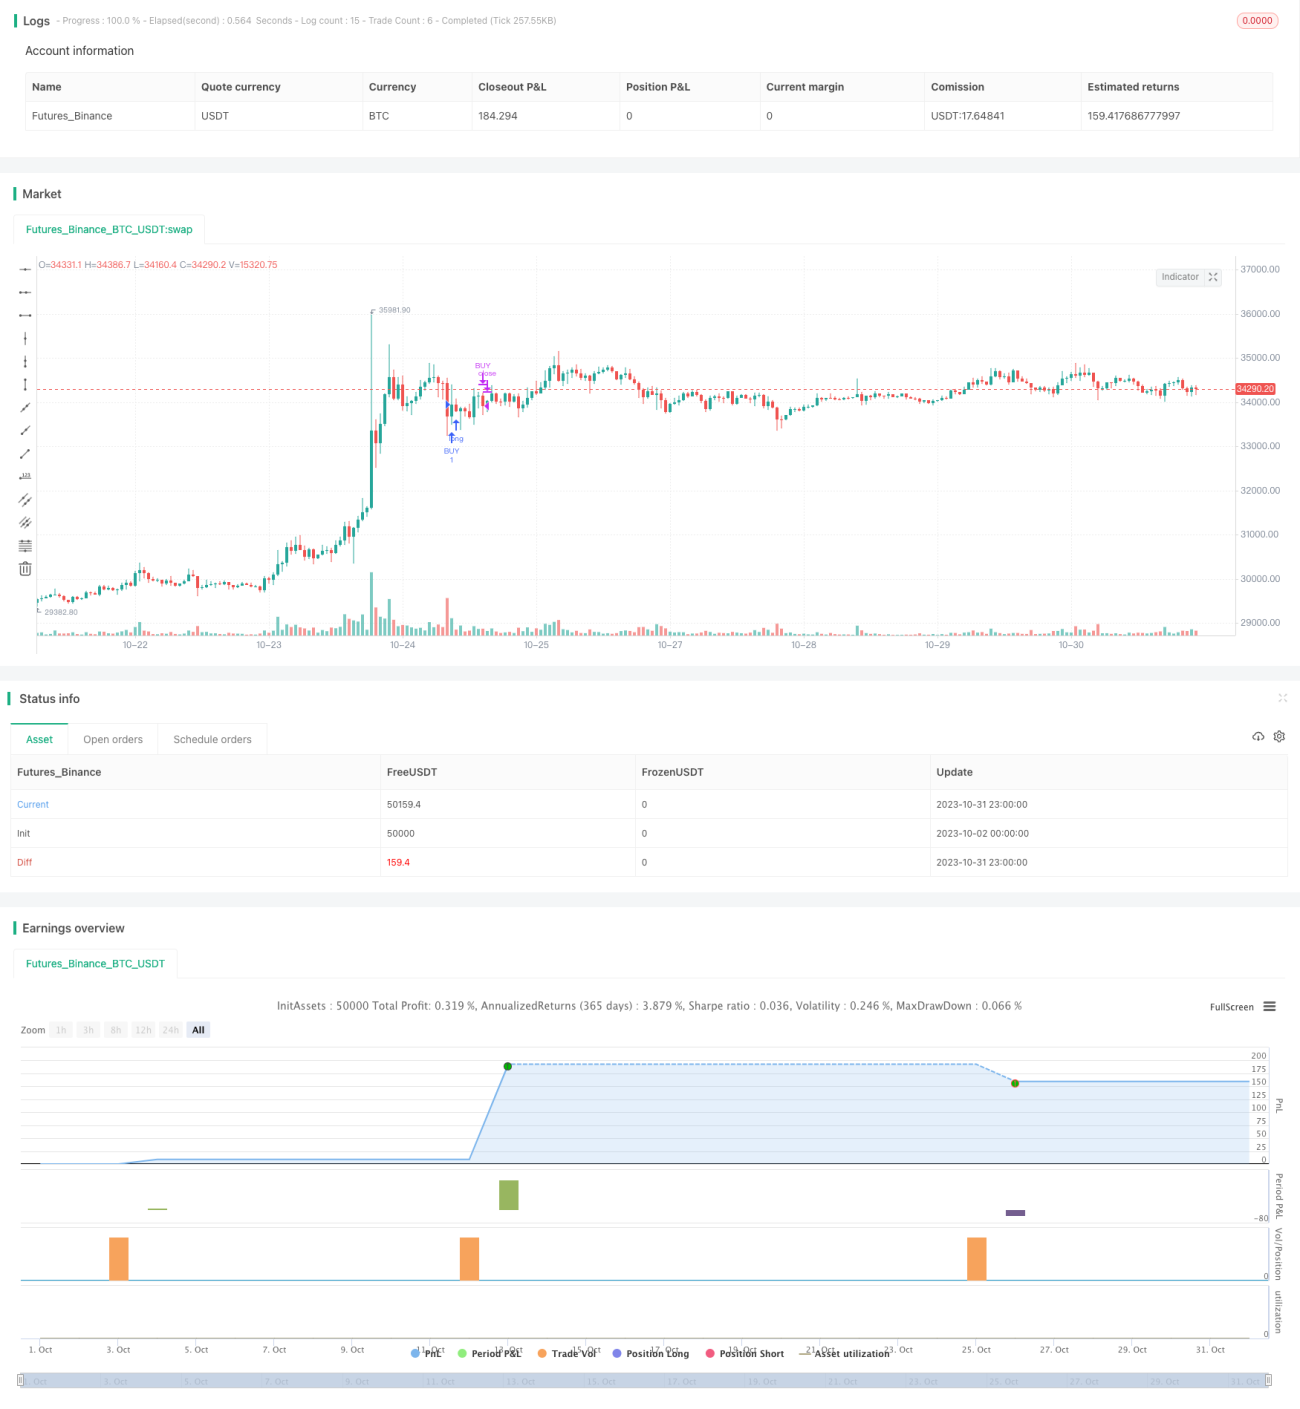
/*backtest
start: 2023-10-02 00:00:00
end: 2023-11-01 00:00:00
period: 1h
basePeriod: 15m
exchanges: [{"eid":"Futures_Binance","currency":"BTC_USDT"}]
*/
// This source code is subject to the terms of the Mozilla Public License 2.0 at https://mozilla.org/MPL/2.0/
// © TraderHalai
// This script was born out of my quest to be able to display strategy back test statistics on charts to allow for easier backtesting on devices that do not natively support backtest engine (such as mobile phones, when I am backtesting from away from my computer). There are already a few good ones on TradingView, but most / many are too complicated for my needs.
//
//Found an excellent display backtest engine by 'The Art of Trading'. This script is a snippet of his hard work, with some very minor tweaks and changes. Much respect to the original author.
//
//Full credit to the original author of this script. It can be found here: https://www.tradingview.com/script/t776tkZv-Hammers-Stars-Strategy/?offer_id=10&aff_id=15271
//
// This script can be copied and airlifted onto existing strategy scripts of your own, and integrates out of the box without implementation of additional functions. I've also added Max Runup, Average Win and Average Loss per trade to the orignal script.
//
//Will look to add in more performance metrics in future, as I further develop this script.
//
//Feel free to use this display panel in your scripts and strategies.
//Thanks and enjoy! :)
//@version=5
// strategy("Strategy BackTest Display Statistics - TraderHalai", overlay=true, default_qty_value= 5, default_qty_type = strategy.percent_of_equity, initial_capital=10000, commission_type=strategy.commission.percent, commission_value=0.1)
//DEMO basic strategy - Use your own strategy here - Jaws Mean Reversion from my profile used here
source = input(title = "Source", defval = close)
smallMAPeriod = input(title = "Small Moving Average", defval = 2)
bigMAPeriod = input(title = "Big Moving Average", defval = 8)
percentBelowToBuy = input(title = "Percent below to buy %", defval = 1)
smallMA = ta.sma(source, smallMAPeriod)
bigMA = ta.sma(source, bigMAPeriod)
buyMA = ((100 - percentBelowToBuy) / 100) * ta.sma(source, bigMAPeriod)[0]
buy = ta.crossunder(smallMA, buyMA)
if(buy)
strategy.entry("BUY", strategy.long)
if(strategy.openprofit >= strategy.position_avg_price * 0.01) // 1% profit target
strategy.close("BUY")
if(ta.barssince(buy) >= 7) //Timed Exit, if you fail to make 1 percent in 7 candles.
strategy.close("BUY")
///////////////////////////// --- BEGIN TESTER CODE --- ////////////////////////
// COPY below into your strategy to enable display
////////////////////////////////////////////////////////////////////////////////
// strategy.initial_capital = 50000
// // Declare performance tracking variables
// drawTester = input.bool(true, "Draw Tester")
// var balance = strategy.initial_capital
// var drawdown = 0.0
// var maxDrawdown = 0.0
// var maxBalance = 0.0
// var totalWins = 0
// var totalLoss = 0
// // Prepare stats table
// var table testTable = table.new(position.top_right, 5, 2, border_width=1)
// f_fillCell(_table, _column, _row, _title, _value, _bgcolor, _txtcolor) =>
// _cellText = _title + "\n" + _value
// table.cell(_table, _column, _row, _cellText, bgcolor=_bgcolor, text_color=_txtcolor)
// // Custom function to truncate (cut) excess decimal places
// truncate(_number, _decimalPlaces) =>
// _factor = math.pow(10, _decimalPlaces)
// int(_number * _factor) / _factor
// // Draw stats table
// var bgcolor = color.new(color.black,0)
// if drawTester
// if barstate.islastconfirmedhistory
// // Update table
// dollarReturn = strategy.netprofit
// f_fillCell(testTable, 0, 0, "Total Trades:", str.tostring(strategy.closedtrades), bgcolor, color.white)
// f_fillCell(testTable, 0, 1, "Win Rate:", str.tostring(truncate((strategy.wintrades/strategy.closedtrades)*100,2)) + "%", bgcolor, color.white)
// f_fillCell(testTable, 1, 0, "Starting:", "$" + str.tostring(strategy.initial_capital), bgcolor, color.white)
// f_fillCell(testTable, 1, 1, "Ending:", "$" + str.tostring(truncate(strategy.initial_capital + strategy.netprofit,2)), bgcolor, color.white)
// f_fillCell(testTable, 2, 0, "Avg Win:", "$"+ str.tostring(truncate(strategy.grossprofit / strategy.wintrades, 2)), bgcolor, color.white)
// f_fillCell(testTable, 2, 1, "Avg Loss:", "$"+ str.tostring(truncate(strategy.grossloss / strategy.losstrades, 2)), bgcolor, color.white)
// f_fillCell(testTable, 3, 0, "Profit Factor:", str.tostring(truncate(strategy.grossprofit / strategy.grossloss,2)), strategy.grossprofit > strategy.grossloss ? color.green : color.red, color.white)
// f_fillCell(testTable, 3, 1, "Max Runup:", str.tostring(truncate(strategy.max_runup, 2 )), bgcolor, color.white)
// f_fillCell(testTable, 4, 0, "Return:", (dollarReturn > 0 ? "+" : "") + str.tostring(truncate((dollarReturn / strategy.initial_capital)*100,2)) + "%", dollarReturn > 0 ? color.green : color.red, color.white)
// f_fillCell(testTable, 4, 1, "Max DD:", str.tostring(truncate((strategy.max_drawdown / strategy.equity) * 100 ,2)) + "%", color.red, color.white)
// // --- END TESTER CODE --- ///////////////