플라잉 드래곤 트렌드 전략


생성 날짜: 2023-11-07 14:57:23 마지막으로 수정됨: 2023-11-07 14:57:23
복사: 0 클릭수: 847
avatar of ChaoZhang ChaoZhang
1
집중하다
1621
수행원

플라잉 드래곤 트렌드 전략

개요

파일론 트렌드 전략은 이동 평균의 종류, 길이 및 오차량을 조정하여 다양한 색의 트렌드 대역을 그리며 트렌드를 판단하고 거래 신호를 생성합니다. 이 전략은 트렌드 판단 정확성과 거래 위험 사이의 균형을 맞추기 위해 다양한 시간 동안 최적의 파라미터 조합을 찾을 수 있습니다.

전략 원칙

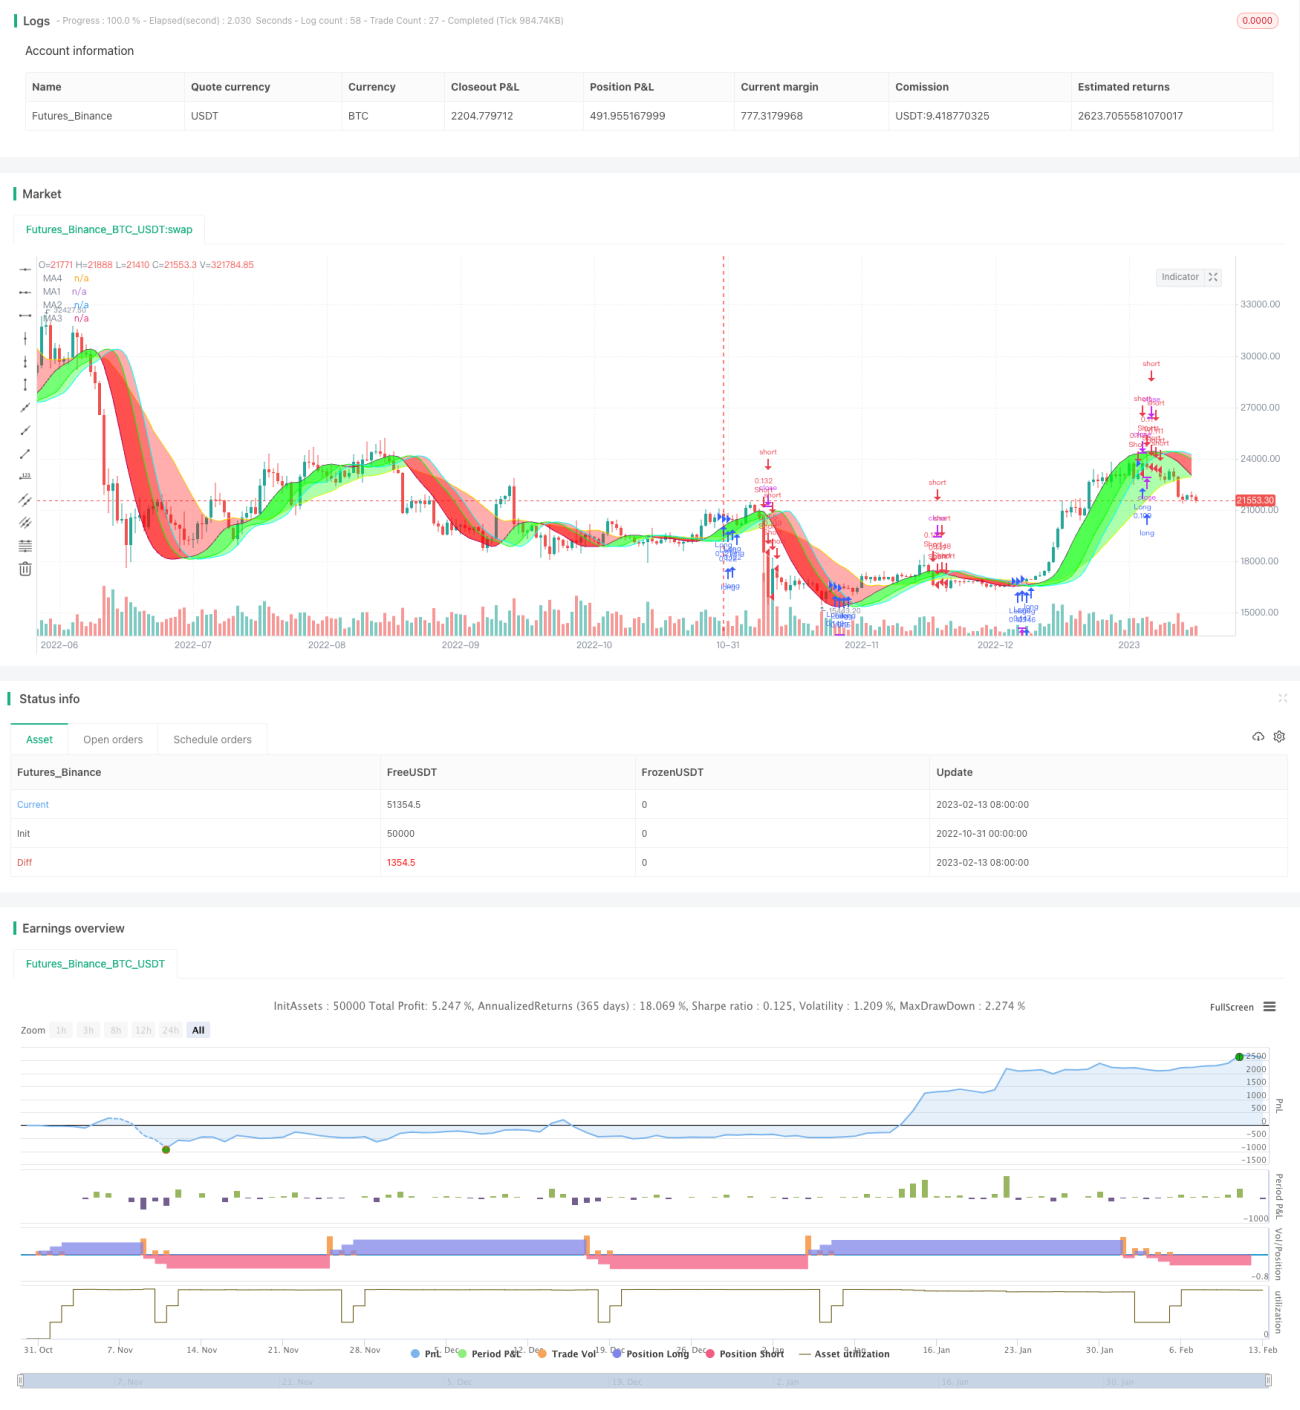
이 전략은 두 개의 이동 평균을 사용하여 MA1과 MA4로 표시된 트렌드 대역을 그리는데, MA1은 빠른 이동 평균이고, MA4는 느린 이동 평균입니다. 동시에, MA1은 3 개의 오프셋을 설정합니다. (Offset1, Offset2, Offset3) MA2와 MA3를 형성합니다. 가격 라인이 다른 이동 평균을 통과하면 거래 신호가 다른 정도가 형성됩니다.

사용자는 5가지의 리스크 레벨을 선택할 수 있으며, 다른 리스크 레벨에서, 다른 이동 평균을 통과하면 거래 신호가 형성됩니다. 위험은 높은 것부터 낮은 것까지 순서대로: MA1 Offset1, MA2, MA3, MA4, 모든 트렌드 배드 색이 일치합니다. 트렌드 배드 색은 현재 트렌드 방향을 나타냅니다. 녹색은 상승 추세, 빨간색은 하락 추세입니다.

또한, 이 전략은 스톱로스를 사용하도록 허용하고, 장전, 단전 또는 양방향 거래를 선택할 수 있다.

우위 분석

  • 다양한 시기를 통해 최적의 배열을 찾아서 보다 광범위한 시장 환경에 맞출 수 있습니다.
  • 다양한 선택 가능한 이동 평균 유형을 제공하여 다양한 품종에 최적화 할 수 있습니다.
  • 조정 가능한 오차량은 트렌드를 더 정확하게 판단하는 전략의 핵심입니다.
  • 선택 가능한 리스크 레벨, 위험과 수익의 균형
  • 다양한 매개 변수들을 유연하게 조합할 수 있고, 최적화할 수 있는 공간이 넓다.
  • 직관적인 트렌드띠, 명확한 시각적 거래 신호를 형성합니다.
  • 손해 방지 기능을 지원하여 위험을 제어합니다.

위험 분석

  • 위험 등급이 높으면 잘못된 신호가 발생하기 쉽다. 위험 등급을 낮추거나 매개 변수를 조정해야 한다.
  • 추세가 역전될 경우, 연쇄적인 상쇄 손실이 발생할 수 있으며,
  • 다양한 품종은 개별적으로 테스트 및 최적화 매개 변수를 필요로 하며, 모두 동일한 매개 변수가 적용될 수 없습니다.
  • 높은 주파수 거래에서는 빠른 이동 평균으로 조정해야하며 느린 이동 평균으로 조정해야합니다.
  • 매개 변수 최적화가 잘못되면 너무 민감하거나 느려져 여러 번 테스트 최적화가 필요합니다.

위험등급을 단계적으로 낮추고, 변수조합 테스트를 늘리고, 다른 품종에 대해 개별적으로 최적화한 변수를 사용하여 위험을 제어하고 줄일 수 있다.

최적화 방향

  • 다른 종류의 이동 평균 조합을 시도해보세요.
  • 더 많은 길이 변수를 테스트하여 최적의 길이를 찾으십시오.
  • 이 모든 것은 오비스트레이션을 조정하는 데 도움이 됩니다.
  • 다양한 품종에 따라 세그먼트 최적화 매개 변수
  • 정지점을 최적화하고 정지점을 고려합니다.
  • 다른 포지션 개설 규칙을 시도해 보세요.
  • 필터에 최적화가 필요한지 평가
  • 트렌드 강도 지표와 같은 보조를 고려하십시오.

요약하다

파일론 트렌드 전략은 이동 평균의 교묘한 조합을 통해 시각화 된 트렌드 거래 시스템을 설계했습니다. 이 전략은 파라미터가 조정 가능하며, 다양한 품종과 시장 환경에 대해 정밀하게 최적화하여 안정성과 민감성 사이에 최적의 균형을 찾을 수 있습니다. 다중 패러미터 포메이션은 최적화 할 충분한 공간을 제공합니다.

전략 소스 코드
/*backtest
start: 2022-10-31 00:00:00
end: 2023-02-14 00:00:00
period: 1d
basePeriod: 1h
exchanges: [{"eid":"Futures_Binance","currency":"BTC_USDT"}]
*/

// This source code is subject to the terms of the Mozilla Public License 2.0 at https://mozilla.org/MPL/2.0/
// © MarkoP010 2023

//@version=5
//The basic idea of the strategy is to select the best set of MAs, types, lenghts and offsets, which draws red trend bands for downtrend (and green for uptrend).
//Strategy executes by selected risk level either when there is MA crossover with price (MA1 Offset1 on Highest risk level, MA2 on Low risk level) or three bands with the same color on at the same time (on Lowest risk level).
//Strategy plots user selectable Moving Average lines and a colored trend band between the MA lines. The trend bands can be turned off individually if required.
//The Offset option shifts the selected MA with the set number of steps to the right. That is where the Magic happens and the Dragon roars!

//Strategy version 1.0
strategy("Flying Dragon Trend Strategy", shorttitle="FD Trend Strategy", overlay=true, pyramiding=3, initial_capital=100000, default_qty_type=strategy.percent_of_equity, default_qty_value=5, commission_type=strategy.commission.cash_per_order, commission_value=10, calc_on_order_fills=false, process_orders_on_close=true)

strDirection = input.string(defval="Both", title="Strategy Direction", options=["Both", "Long", "Short"], group="Strategy") //Strategy direction selector by DashTrader
strSelection = strDirection == "Long" ? strategy.direction.long : strDirection == "Short" ? strategy.direction.short : strategy.direction.all //Strategy direction selector by DashTrader
strategy.risk.allow_entry_in(strSelection)

riskLevel = input.string(defval="Medium", title="Risk Level", options=["Highest", "High", "Medium", "Low", "Lowest"], tooltip="Strategy execution criteria. When Highest then MA1 Offset1 crossover with price, when Low then MA2 Offset crossover, when Lowest then all the Bands are the same color.", group="Strategy")

useStop = input(defval=false, title="Use Stop Loss", inline="SL", group="Strategy")
stopPrct = input.int(defval=10, title=" %", minval=0, maxval=100, step=1, inline="SL", group="Strategy") / 100

//Moving Averages function
MA(source, length, type) =>
    type == "EMA" ? ta.ema(source, length) :
     type == "HMA" ? ta.hma(source, length) :
     type == "RMA" ? ta.rma(source, length) :
     type == "SMA" ? ta.sma(source, length) :
     type == "SWMA" ? ta.swma(source) :
     type == "VWMA" ? ta.vwma(source, length) :
     type == "WMA" ? ta.wma(source, length) :
     na

//Inputs
ma1Type = input.string(defval="HMA", title="", inline="MA1", options=["EMA", "HMA", "RMA", "SMA","SWMA", "VWMA", "WMA"], group="Leading Moving Average") 
ma1Length = input.int(defval=35, title="",minval=1, inline="MA1", group="Leading Moving Average")
ma1Source = input(defval=close, title="", tooltip="For short timeframes, minutes to hours, instead of Default values try Lowest risk level and HMA75 with Offsets 0,1,4 and SMA12 with Offset 6.", inline="MA1", group="Leading Moving Average")
ma1Color  = input(defval=color.purple, title="", inline="MA-1", group="Leading Moving Average")
//useMa1Offset = input(defval=false, title="Use offset to MA-1", inline="MA1", group="Leading Moving Average")
ma1Offset = input.int(defval=0, title="Offset1 Steps", minval=0, maxval=10, step=1, tooltip="The Magic happens here! The offset to move the line to the right.", inline="MA-1", group="Leading Moving Average")
ma1 = MA(ma1Source, ma1Length, ma1Type)[ma1Offset]

ma2Color  = input(defval=color.lime, title="", inline="MA-2", group="Leading Moving Average")
//useMa2Offset = input(defval=true, title="Use offset to MA2", inline="MA-2", group="Leading Moving Average")
ma2Offset = input.int(defval=4, title="Offset2 Steps", minval=0, maxval=10, step=1, tooltip="The Magic happens here! The offset to move the line to the right.", inline="MA-2", group="Leading Moving Average")
ma2 = ma1[ma2Offset]

ma3Color  = input(defval=color.aqua, title="", inline="MA-3", group="Leading Moving Average")
//useMa3Offset = input(defval=false, title="Use offset to MA3", inline="MA-3", group="Leading Moving Average")
ma3Offset = input.int(defval=6, title="Offset3 Steps", minval=0, maxval=10, step=1, tooltip="The Magic happens here! The offset to move the line to the right.", inline="MA-3", group="Leading Moving Average")
ma3 = ma1[ma3Offset]

ma4Type = input.string(defval="SMA", title="", inline="MA4", options=["EMA", "HMA", "RMA", "SMA","SWMA", "VWMA", "WMA"], group="Lagging Moving Average") 
ma4Length = input.int(defval=22, title="",minval=1, inline="MA4", group="Lagging Moving Average")
ma4Source = input(defval=close, title="", inline="MA4", group="Lagging Moving Average")
ma4Color  = input(defval=color.yellow, title="", inline="MA-4", group="Lagging Moving Average")
//useMa4Offset = input(defval=true, title="Use offset to MA4", inline="MA-4", group="Lagging Moving Average")
ma4Offset = input.int(defval=2, title="Offset Steps", minval=0, maxval=10, step=1, tooltip="The Magic happens here! The offset to move the line to the right.", inline="MA-4", group="Lagging Moving Average")
ma4 = MA(ma4Source, ma4Length, ma4Type)[ma4Offset]

bandTransp = input.int(defval=60, title="Band Transparency", minval=20, maxval=80, step=10, group="Banding")
useBand1 = input(defval=true, title="Band 1", inline="Band", group="Banding")
band1Transp = useBand1 ? bandTransp : 100
band1clr = ma1 > ma2 ? color.new(#00ff00, transp=band1Transp) : color.new(#ff0000, transp=band1Transp)
useBand2 = input(defval=true, title="Band 2", inline="Band", group="Banding")
band2Transp = useBand2 ? bandTransp : 100
band2clr = ma1 > ma3 ? color.new(#00ff00, transp=band2Transp) : color.new(#ff0000, transp=band2Transp)
useBand3 = input(defval=true, title="Band 3", tooltip="Up trend green, down trend red. Colors get reversed if MA1 lenght is greater than MA2 lenght, or they are different type and MA2 quicker. In that case, just reverse your selections for MA1 and MA2, or let it be as is.", inline="Band", group="Banding")
band3Transp = useBand3 ? bandTransp : 100
band3clr = ma1 > ma4 ? color.new(#00ff00, transp=band3Transp) : color.new(#ff0000, transp=band3Transp)

//Graphs
piirto1 = plot(ma1, color = ma1Color, title="MA1")
piirto2 = plot(ma2, color = ma2Color, title="MA2")
piirto3 = plot(ma3, color = ma3Color, title="MA3")
piirto4 = plot(ma4, color = ma4Color, title="MA4")

fill(piirto1, piirto2, color=band1clr)
fill(piirto1, piirto3, color=band2clr)
fill(piirto1, piirto4, color=band3clr)

//Strategy entry and stop conditions

longCondition = riskLevel == "Highest" ? ma1Source > ma1 : riskLevel == "High" ? ma1Source > ma2 : riskLevel == "Medium" ? ma1Source > ma3 : riskLevel == "Low" ? ma1Source > ma4 : riskLevel == "Lowest" ? ma1 > ma2 and ma1 > ma3 and ma1 > ma4 : na
shortCondition = riskLevel == "Highest" ? ma1Source < ma1 : riskLevel == "High" ? ma1Source < ma2 : riskLevel == "Medium" ? ma1Source < ma3 : riskLevel == "Low" ? ma1Source < ma4 : riskLevel == "Lowest" ? ma1 < ma2 and ma1 < ma3 and ma1 < ma4 : na

stopLprice = useStop == true ? strategy.position_avg_price * (1-stopPrct) : na
stopSprice = useStop == true ? strategy.position_avg_price * (1+stopPrct) : na

if (longCondition)
    strategy.entry("Long",strategy.long)
    strategy.exit("Long Stop", "Long", stop=stopLprice)    
if (shortCondition)
    strategy.entry("Short",strategy.short)
    strategy.exit("Short Stop", "Short", stop=stopSprice)

//End