MCL-YG 변동성 돌파 거래 전략

개요
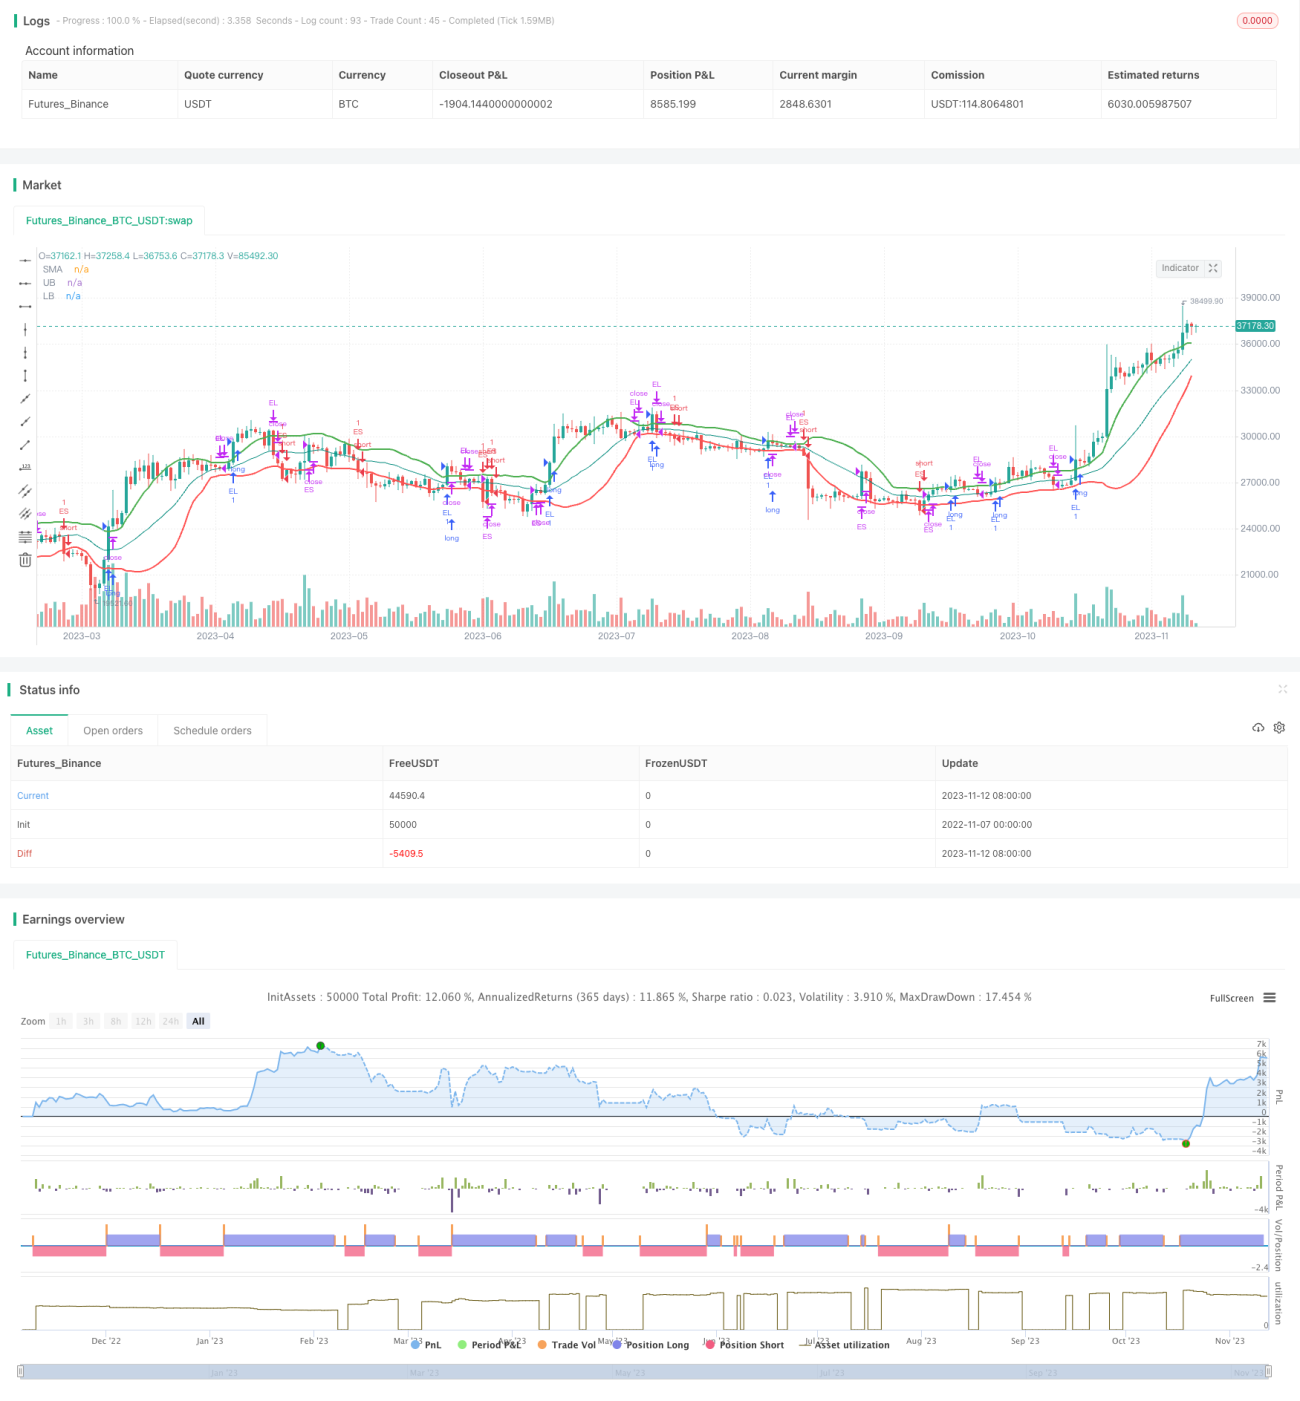
이 전략은 부린 띠의 돌파구를 사용하여 거래 신호를 탐지하여 MCL와 YG의 두 가지 긍정적으로 관련된 자산에 대한 쌍거래를 구현합니다. MCL 가격이 부린 띠를 터치 할 때, MCL를 더하고 YG를 더합니다.
전략 원칙
우선, 이 전략은 특정 주기 동안의 종식 가격에 기초하여 SMA 평균선과 표준 차 StdDev를 계산한다. 그리고 SMA 평균선 위에 아래로 각각 1개의 오차량을 추가하여, 브린 밴드의 상반도와 하반도를 형성한다. 가격이 상반도를 접촉할 때 구매 신호를 생성하고, 하반도를 접촉할 때 판매 신호를 생성한다.
이 전략은 부린띠의 돌파구 거래 사고방식을 채택합니다. 즉, 가격이 돌파구에 올라갈 때 더 많이 보고, 돌파구에 내려갈 때 아무것도 보지 않습니다. 부린띠는 채널 폭을 동적으로 조정하여 시장 변화에 적응하여 시장의 흔들림의 잡음을 효과적으로 필터링 할 수 있습니다. 고정된 채널과 달리 부린띠의 채널 폭은 시장의 변동성 변화에 따라 확장 또는 축소됩니다.
두 가지 긍정적으로 관련된 자산인 MCL와 YG에 대해 쌍거래한다. MCL이 경로를 돌파할 때 MCL 가격이 상승 추세에 있다는 것을 나타냅니다. 이 때 더 많은 MCL을 하고, 동시에 YG를 <unk>니다. 즉, 더 강한 자산을 구입하고, 더 약한 자산을 판매하여 두 자산 가격 차이에서 이익을 얻습니다.
전략적 이점
- 브린 띠 기반의 브레이크 트레이드는 시장의 소음을 필터링하고 트렌드를 식별합니다.
- 관련 자산의 가격 차이의 알파 수익을 얻을 수 있는 관련 자산의 쌍을 채택
- 동적으로 포지션 규모를 조정하여 개별 거래의 위험을 효과적으로 제어합니다.
- 표준의 돌파 입구와 회귀 중축 출구 논리, 전략 논리는 간단하고 명확하다
전략적 위험
- 부린 밴드 파라미터를 잘못 설정하면 거래 빈도가 너무 높거나 신호가 보이지 않을 수 있습니다.
- 관련 자산 간의 연관성이 감소하면 쌍 거래 알파 수익이 감소합니다.
- 파격 거래는 파동하는 시장의 가짜 파격으로 속일 수 있으며 이로 인해 손실이 발생합니다.
- 단독 손실로 인한 무상 손실이 확대될 수 있습니다.
매개 변수를 최적화하고, 더 연관성이 강하고, 유동성이 좋은 거래 대상을 선택하고, 합리적인 스톱 포지션을 설정하는 등의 방법으로 위험을 줄일 수 있다.
전략 최적화
- 브린 띠 변수를 최적화하여 최적의 변수 조합을 찾습니다.
- 더 많은 관련 자산이 거래 대상으로 테스트되고, 관련성이 높은 포트폴리오를 선택합니다.
- 단편적 손실을 제한하기 위해 Stop Loss Logic을 추가합니다.
- 더 많은 필터링 조건을 추가하여 가짜 뚫림 속임수를 피하십시오.
- 거래량 확인과 같은 다른 지표와 함께, 현장 진입 타이밍
요약하다
이 전략은 전체적으로 단순하고 직접적인 것으로 보이며, 브린띠를 통해 트렌드를 캡처하고, 거래의 알파 수익을 얻습니다. 그러나 몇 가지 변수 최적화, 중지 손실 및 쌍의 선택과 같은 최적화 가능한 공간이 있습니다. 다른 변수, 거래 대상을 테스트하고, 트렌드 필터링과 같은 방법을 적절하게 도입함으로써 더 나은 전략 효과를 얻을 수 있습니다.
- 1