RSI 이산 발산 전략

개요
이 전략은 RSI 지표와 EMA 평균의 교차 상황을 계산하여 다공평한 상황을 판단하고 RSI와 가격의 오차를 결합하여 잠재적인 매매점을 찾기 위해 트렌드 추적 전략에 속한다.
전략 원칙
-
길이는 14의 RSI 지표로 계산되며, RSI 위쪽이 50 분기선을 통과하면 더 많은 신호를 보며, 아래쪽은 더 많은 신호를 보며.
-
RSI의 20주기 EMA 평균선과 14주기 EMA 평균선을 계산하여, 빠른 선이 느린 선을 통과하면 구매 신호로, 낮은 선이 판매 신호로 <unk>니다.
-
RSI와 가격의 오차를 탐지하는 방법:
-
다중이 이탈: 가격 혁신이 낮지만 RSI는 혁신이 낮지 않아 구매 신호를 제공합니다.
-
숨겨진 다중 돌림: 가격 혁신이 높지만 RSI는 혁신이 높지 않아 구매 신호
-
공백이 떨어져: 가격이 혁신적이지만 RSI는 혁신적이지 않습니다.
-
숨겨진 공백: 가격 혁신이 낮지만 RSI는 혁신이 낮지 않아 판매 신호를 제공합니다.
- 선택적으로 백분율 중지 및 ATR 중지 포함된 중지 전략을 실행할 수 있습니다.
우위 분석
-
RSI 지표의 장점은 과매매를 감지할 수 있다는 것입니다. EMA 평균의 장점은 부드러운 역할을 할 수 있다는 것입니다.
-
RSI와 가격의 오차는 트렌드 반전 전에 미리 신호를 줄 수 있다.
-
두 가지 지표 신호를 통합하여 상호 검증하여 전략의 안정성을 높일 수 있습니다.
-
손해 방지 메커니즘은 단일 손실을 제어합니다.
위험 분석
-
RSI는 가격 변동에 따른 지수 지표로서, 가격이 급격히 변동할 때 RSI 지표의 효용은 할인된다.
-
EMA 평행선에는 시간 지연 문제가 있으며, 전환점을 정확하게 결정할 수 없다.
-
신호에서 벗어난 경우, 가짜 신호가 발생할 수 있으며, 가격이 원래의 추세를 계속 실행하는 경우.
-
부적절한 스톱포인트 설정으로 불필요한 스톱포인트가 발생할 수 있습니다.
-
이 철수에는 상당한 재정적 지원이 필요할 것입니다.
최적화 방향
-
RSI와 EMA의 계산에 대해 다양한 변수를 테스트하여 최적의 변수 조합을 찾을 수 있습니다.
-
조합 최적화를 위해 MACD와 같은 다른 지표로 EMA 평균선을 대체하는 것을 고려할 수 있다.
-
확인 메커니즘을 설정할 수 있으며, 가짜 이탈의 발생을 방지할 수 있다. 필요한 경우 연속적으로 여러 개의 이탈 신호가 트리거된다.
-
수익을 고정하기 위한 차단 전략을 추가하십시오.
-
캔들리스틱 패턴과 같은 단기 신호를 기반으로 입장이 가능하며, 이 전략과 함께 트렌드를 판단한다.
요약하다
이 전략은 RSI 지표의 과매매 판단, EMA의 트렌드 판단 및 기각 신호의 예측을 통합하여 비교적 완전한 트렌드 추적 시스템을 형성한다. 변수 조정 및 조합 최적화의 기반에서 더 나은 전략 효과를 얻을 수 있다. 그러나 여전히 트렌드 시장의 충격과 가짜 신호의 방해를 방지하는 데 주의를 기울여야 한다. 엄격한 자금 관리를 통해 이 전략은 중장선에서 안정적인 초과 수익을 얻을 수 있다.
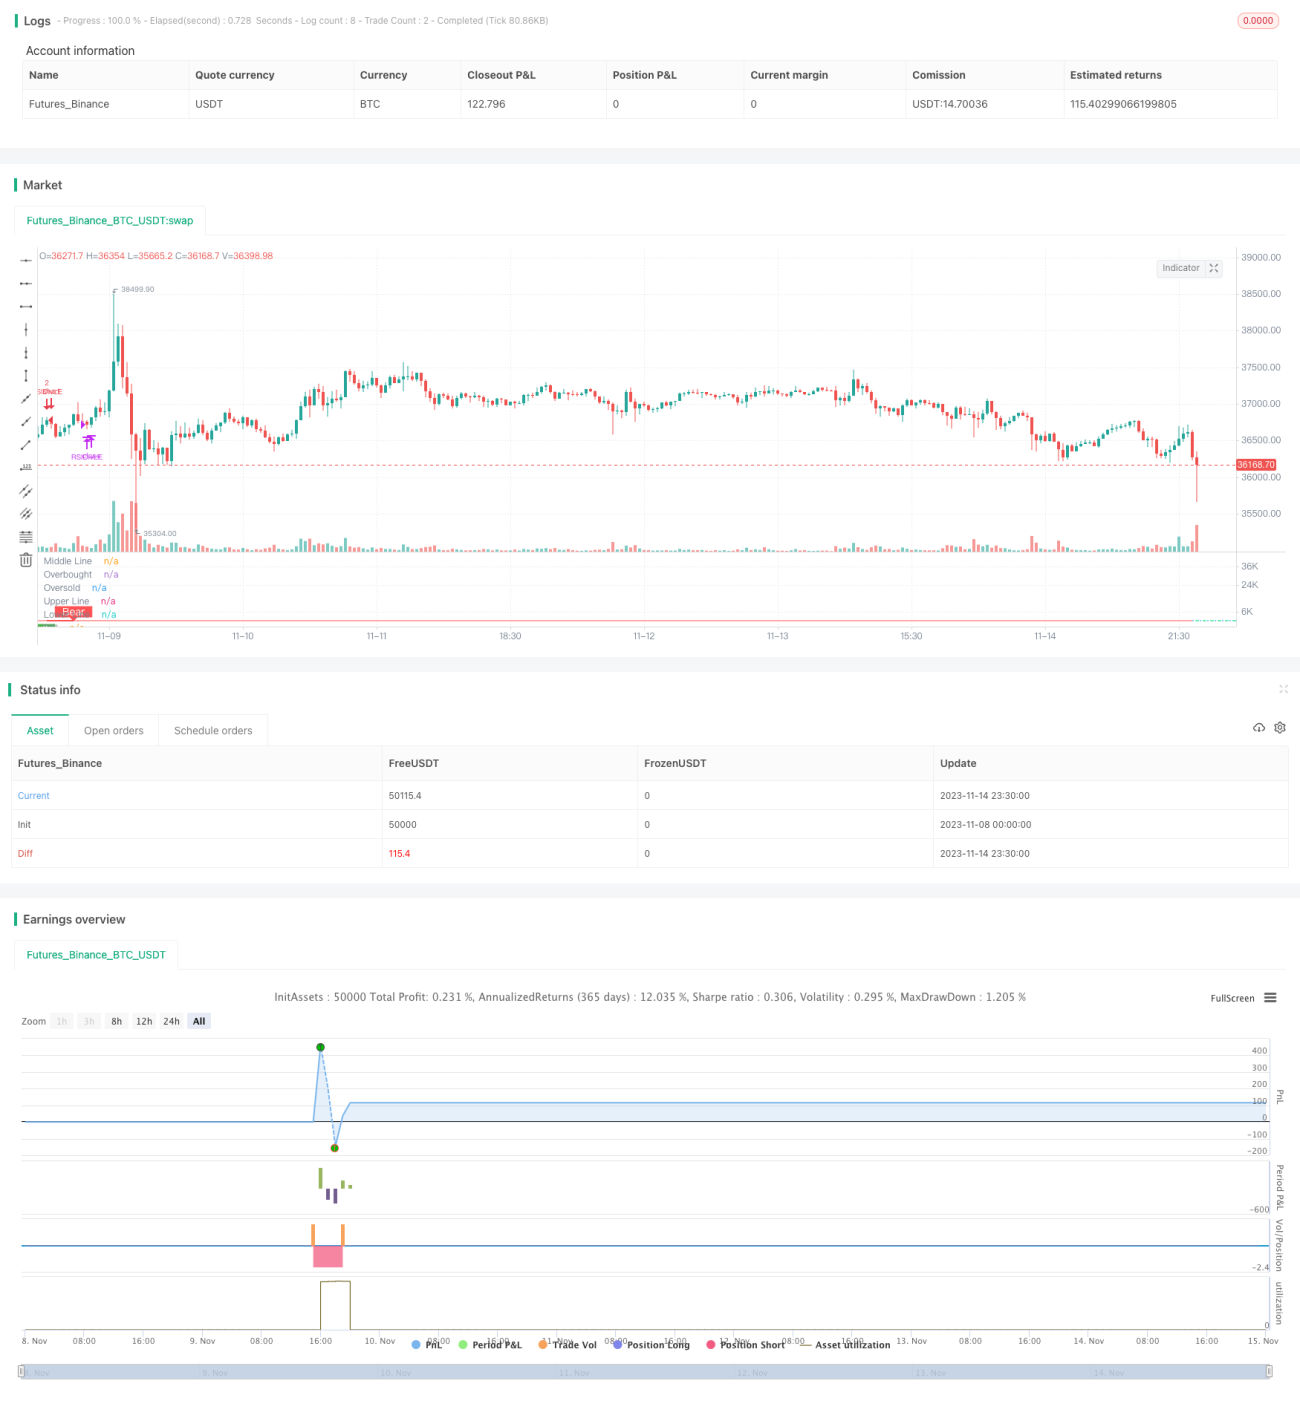
/*backtest
start: 2023-11-08 00:00:00
end: 2023-11-15 00:00:00
period: 30m
basePeriod: 15m
exchanges: [{"eid":"Futures_Binance","currency":"BTC_USDT"}]
*/

//@version=4
strategy(title="RSI Divergence Indicator", overlay=false,pyramiding=2, default_qty_value=2,   default_qty_type=strategy.fixed, initial_capital=10000, currency=currency.USD)

len = input(title="RSI Period", minval=1, defval=14)- 1