다중 시간 프레임 RSI 이동 평균 교차 전략

개요
다중 시간 프레임 RSI 평행선 교차 전략은 다중 시간 프레임의 트렌드 추적 전략이다. 이 전략은 동시에 여러 시간 프레임의 RSI 지표를 사용하며, 각 시간 프레임의 RSI에 대해 중도 이동 평균을 처리하여, 최종적으로 두 종합 신호 지표로 통합되며, 두 신호 지표가 금색이 되면 더 많은 것을 하고, 사형이 되면 공백을 만든다. 전형적인 쌍평행선 교차 전략이다.
원칙
이 전략은 먼저 여러 시간 프레임 (예: 1분, 5분, 15분 등) 에 대한 RSI 지표를 각각 계산하고, 각 시간 프레임의 RSI를 15의 길이의 가중된 이동 평균 (예: VMA) 으로 처리하여 각 시간 프레임의 RSI 평균을 얻습니다.
다음으로, 모든 시간 프레임의 RSI 평균을 동등한 무게로 결합하여 각각 빠른 라인과 느린 라인의 두 신호로 결합합니다. 빠른 라인은 100 주기의 EMA이며 느린 라인은 150 주기의 EMA입니다.
빠른 선이 아래에서 위로 느린 선을 뚫을 때 구매 신호를 생성하고 빠른 선이 위에서 아래로 느린 선을 뚫을 때 판매 신호를 생성합니다. 이렇게, 다중 시간 프레임 RSI의 통합 교차 신호는 트렌드를 효과적으로 추적 할 수 있으며, 단기 시장 소음을 필터링 할 수 있습니다.
장점
-
다중 시간 프레임 통합, 가격 곡선을 평평하게하고 가짜 돌파구를 효과적으로 필터링 할 수 있습니다.
-
RSI 지표는 오버 바이 오버 소드를 반영할 수 있고, 오버 다운을 쫓는 것을 피할 수 있다.
-
쌍평선 시스템은 단일평선 시스템보다 더 나은 포지션 보유 효과가 있다.
-
VMA가 SMA가 아닌 VMA를 사용하면 단기 변동이 평균선에 미치는 영향을 줄일 수 있다.
위험
-
다중 시간 프레임 전략, 파라미터 조정 요구 사항이 높으며, 부적절한 설정으로 너무 일찍 또는 너무 늦게 출전할 수 있다.
-
평균선 시스템은 곡선을 잘 맞추지 못하고, 트렌드 전환점에서는 더 좋지 않다.
-
RSI 지표는 반동 신호에 주의해야 합니다.
해결 방법: 시간 프레임 파라미터 설정을 조정; MACD와 같은 다른 지표와 함께 추세를 판단; RSI 신호에서 벗어난 경고.
최적화 방향
-
시간 프레임의 수와 파라미터 설정을 최적화하여 트렌드를 더 잘 포착합니다.
-
위험을 통제하기 위해 손해배상 제도를 도입하는 것을 고려하십시오.
-
다른 지표들과 함께 추세와 탈선에 대한 판단을 통해 의사결정의 질을 향상시킬 수 있습니다.
-
다양한 포지션 주기의 변수를 테스트하여 최적의 포지션 효과를 찾습니다.
요약하다
다중 시간 프레임 RSI 평행선 교차 전략은 여러 시간 범위 RSI 지표의 통합 판단을 통해 평행선 시스템을 사용하여 가격 곡선을 평형화하고 거래 신호를 생성하며, 전형적인 다중 시간 프레임 트렌드 추적 전략에 속한다. 이 전략의 장점은 트렌드를 효과적으로 추적 할 수 있으며 동시에 잡음을 필터링 할 수 있다는 것입니다. 그러나 파라미터 조정 및 위험 제어에주의를 기울여야합니다.
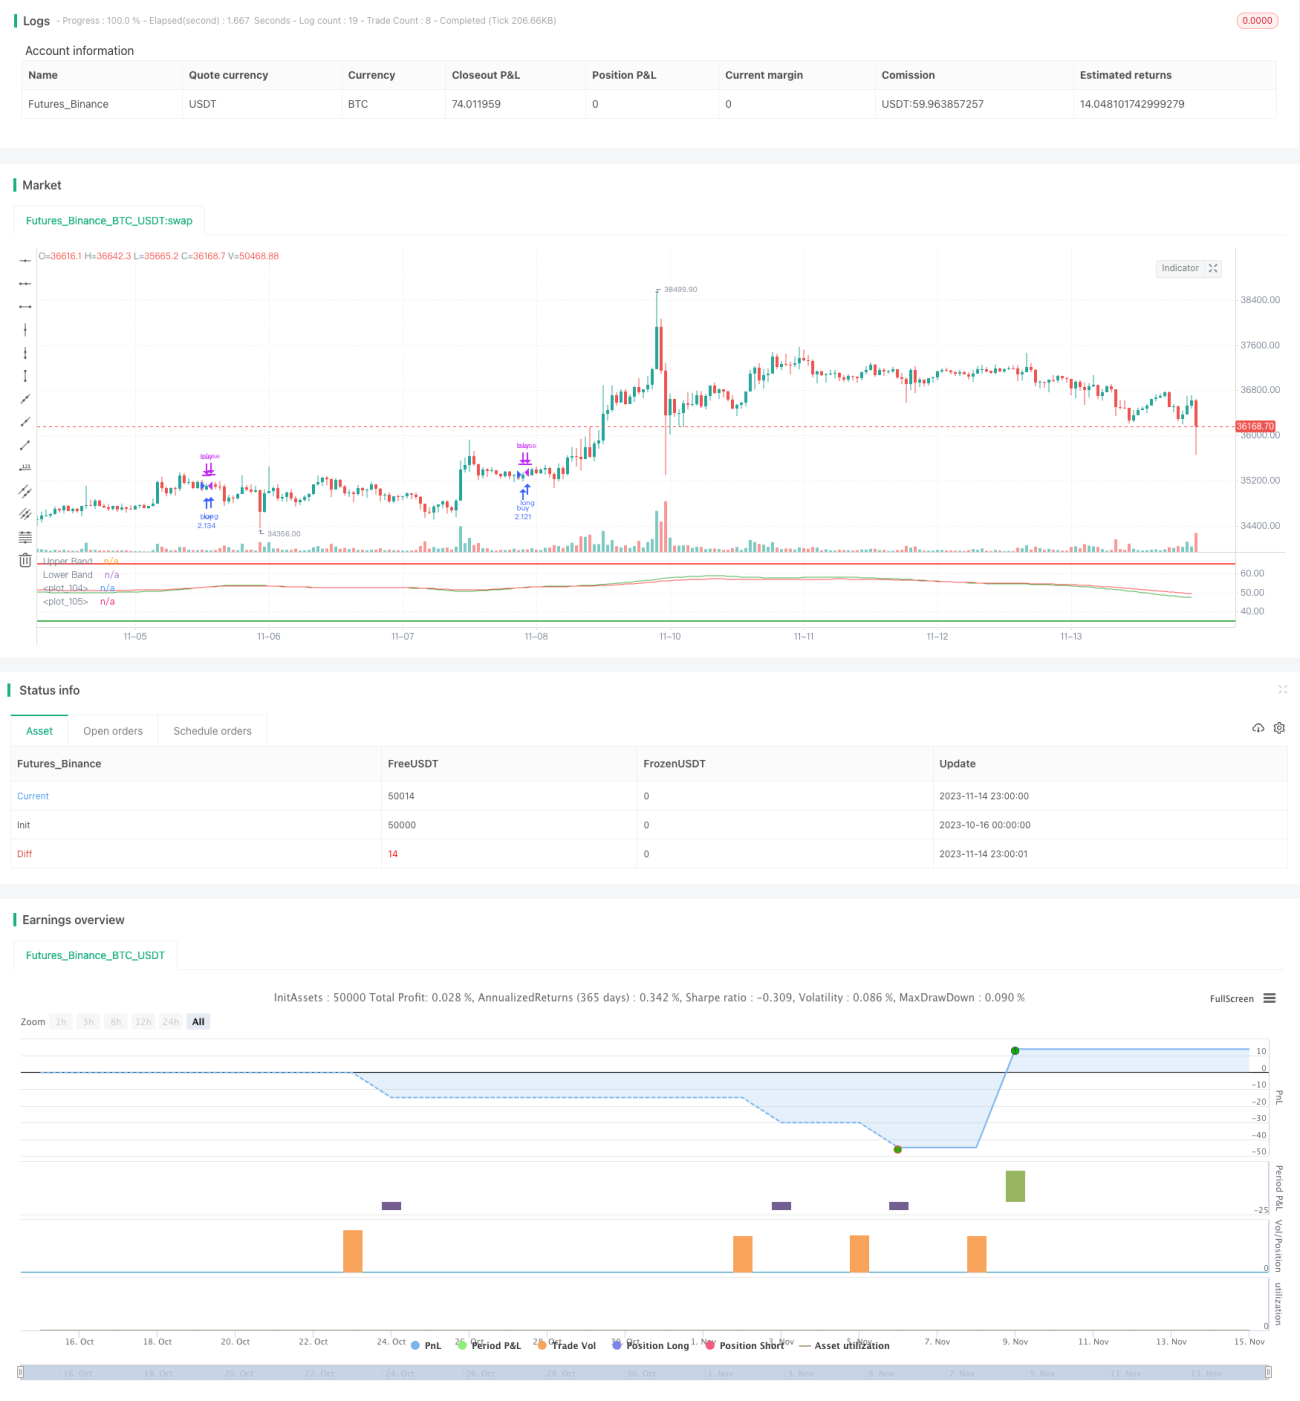
/*backtest
start: 2023-10-16 00:00:00
end: 2023-11-15 00:00:00
period: 1h
basePeriod: 15m
exchanges: [{"eid":"Futures_Binance","currency":"BTC_USDT"}]
*/

//@version=4
strategy(title="RSI multitimeframe SMA crossover", shorttitle="RSI multitimeframe strategy", default_qty_type= strategy.percent_of_equity, margin_long=50, default_qty_value=150)

res1 = input(title="Res 01", type=input.resolution, defval="1")- 1