더블 이동 평균 교차 모멘텀 전략


생성 날짜: 2023-11-16 17:25:13 마지막으로 수정됨: 2023-11-16 17:25:13
복사: 0 클릭수: 651
avatar of ChaoZhang ChaoZhang
1
집중하다
1617
수행원

더블 이동 평균 교차 모멘텀 전략

개요

이 전략은 양평선 교차원 원칙을 적용하여 MACD 지표의 트렌드 판단과 배경 돋보이는 교차점을 결합하여 형태 점으로 진입하여 시장의 중간 트렌드를 포착하는 것을 목표로 한다. 주요 논리는 평선 방향으로 전환이 발생했을 때 진입하여 MACD 배경 색상을 통해 돋보이는 교차점을 통해 MACD 직사각형 색상 변화 판단과 함께 진입한다.

전략 원칙

전략은 빠른 EMA와 느린 EMA를 사용하여 양평선, 빠른 느린 선의 교차 방향을 판단한다. 동시에 MACD와 Signal을 계산하고, 그 차이는 직사각형으로 그려진다.

코드에 따르면, 빠른 선의 길이는 12, 느린 선의 길이는 26, 단기 및 장기 추세를 나타냅니다. Signal 길이는 9, 추가적인 부드러운 처리를 수행합니다.

횡단 논리:

  • trend_up = macd > signal: 빠른 선에 느린 선을 통과하여 단기 상승 추세를 나타냅니다.
  • trend_dn = macd < signal: 빠른 선 아래로 느린 선을 통과하여 단기 하향 경향을 나타냅니다.

그리고 그 다음으로,

  • cross_UP = signal[1] >= macd[1] and signal < macd: 빠른 선은 아래에서 느린 선을 통과한다
  • cross_DN = signal[1] <= macd[1] and signal > macd: 빠른 선은 위에서 아래로 느린 선을 통과한다

직사각형의 색상 변화 추세를 판단하는 방법:

  • histA_IsUp = 직사각형 기둥이 0보다 커서 상승 강도를 증가시킵니다.
  • histA_IsDown = 직사각형 기둥이 0보다 작아지고 상승력이 약해지는 것을 나타냅니다.
  • 아래의 동화

전략적 이점

  1. 이중평등선을 사용하여 중기 트렌드 방향을 판단하여 단기 시장 소음으로 방해받지 않도록하십시오.

  2. MACD 지표는 단기 트렌드 및 강도를 판단하여 수익 가능성을 높인다.

  3. 직사각형 도형의 색상 변화는 강도 크기를 결정하고, 진입 시기를 파악할 수 있다.

  4. 횡단점 배경 색상 표지판, 한눈에 볼 수 있는

  5. 다양한 시장 환경에 맞게 사용자 정의 할 수 있는 평행 주기

  6. MACD 변수를 조정하여 지표 효과를 최적화할 수 있습니다.

  7. 여러 가지 진입 확인을 제공합니다: 평행선 방향, 지표 교차, 형태 돌파

전략적 위험

  1. 이중평등선 판단 중장기 추세는 단기 변동에 민감하지 않으며 단선 기회를 놓칠 수 있습니다.

  2. MACD 파라미터가 잘못 설정되어 지표가 제대로 작동하지 않아 잘못된 신호가 발송됩니다.

  3. 평균선과 MACD 신호만 들어오는 데 있어서, 어느 정도의 실명성이 존재합니다.

  4. 손실을 막는 탈퇴 장치가 고려되지 않아 손실이 확대될 위험이 있습니다.

  5. 엄격한 자금 관리 및 지위 통제의 부재

가능한 해결책:

  1. 다른 지표와 결합하여 단기 변동 범위를 제한하고 위험을 통제합니다.

  2. MACD 변수를 최적화하여 다른 시장의 효과를 테스트합니다.

  3. 형태, 모멘텀 등의 요소를 추가하여 신호를 확인합니다.

  4. 단독 손실을 방지하기 위한 손해 방지 장치 구축

  5. 자금 관리 모듈에 가입하여 자금 규모에 따라 단위 포지션을 제어합니다.

전략 최적화 방향

  1. 더 많은 시장 상황에 맞는 최적화된 평형 변수 조합을 테스트합니다.

  2. VWAP, 브린 밴드 중계 등 다양한 종류의 평행선을 시도하세요.

  3. 트래픽을 늘리고 가짜 돌파구를 피하는 것

  4. RSI와 같은 지표와 결합하여 과매매를 확인합니다.

  5. 이동 상쇄, 진동 상쇄와 같은 상쇄 메커니즘을 구축하십시오.

  6. 포지션 관리 메커니즘에 가입하여 자금 크기에 따라 단위 포지션을 제어합니다.

  7. 기계 학습 알고리즘과 결합된 변수 최적화를 고려할 수 있다.

  8. 확장 전략 Universe, 포트폴리오 투자의 방향

요약하다

이 전략은 양평선 트렌드 판단과 MACD 동력 지표를 통합하여 형태적 특징을 추가하여 비교적 안정적인 중기 거래 전략을 구축한다. 핵심 장점은 주요 트렌드 방향을 파악하고 단기 시장 소음으로 방해받지 않는 것이다. 그러나 손실 방지 장치, 위험 관리 등과 같은 몇 가지 최적화 할 수있는 공간이 있습니다.
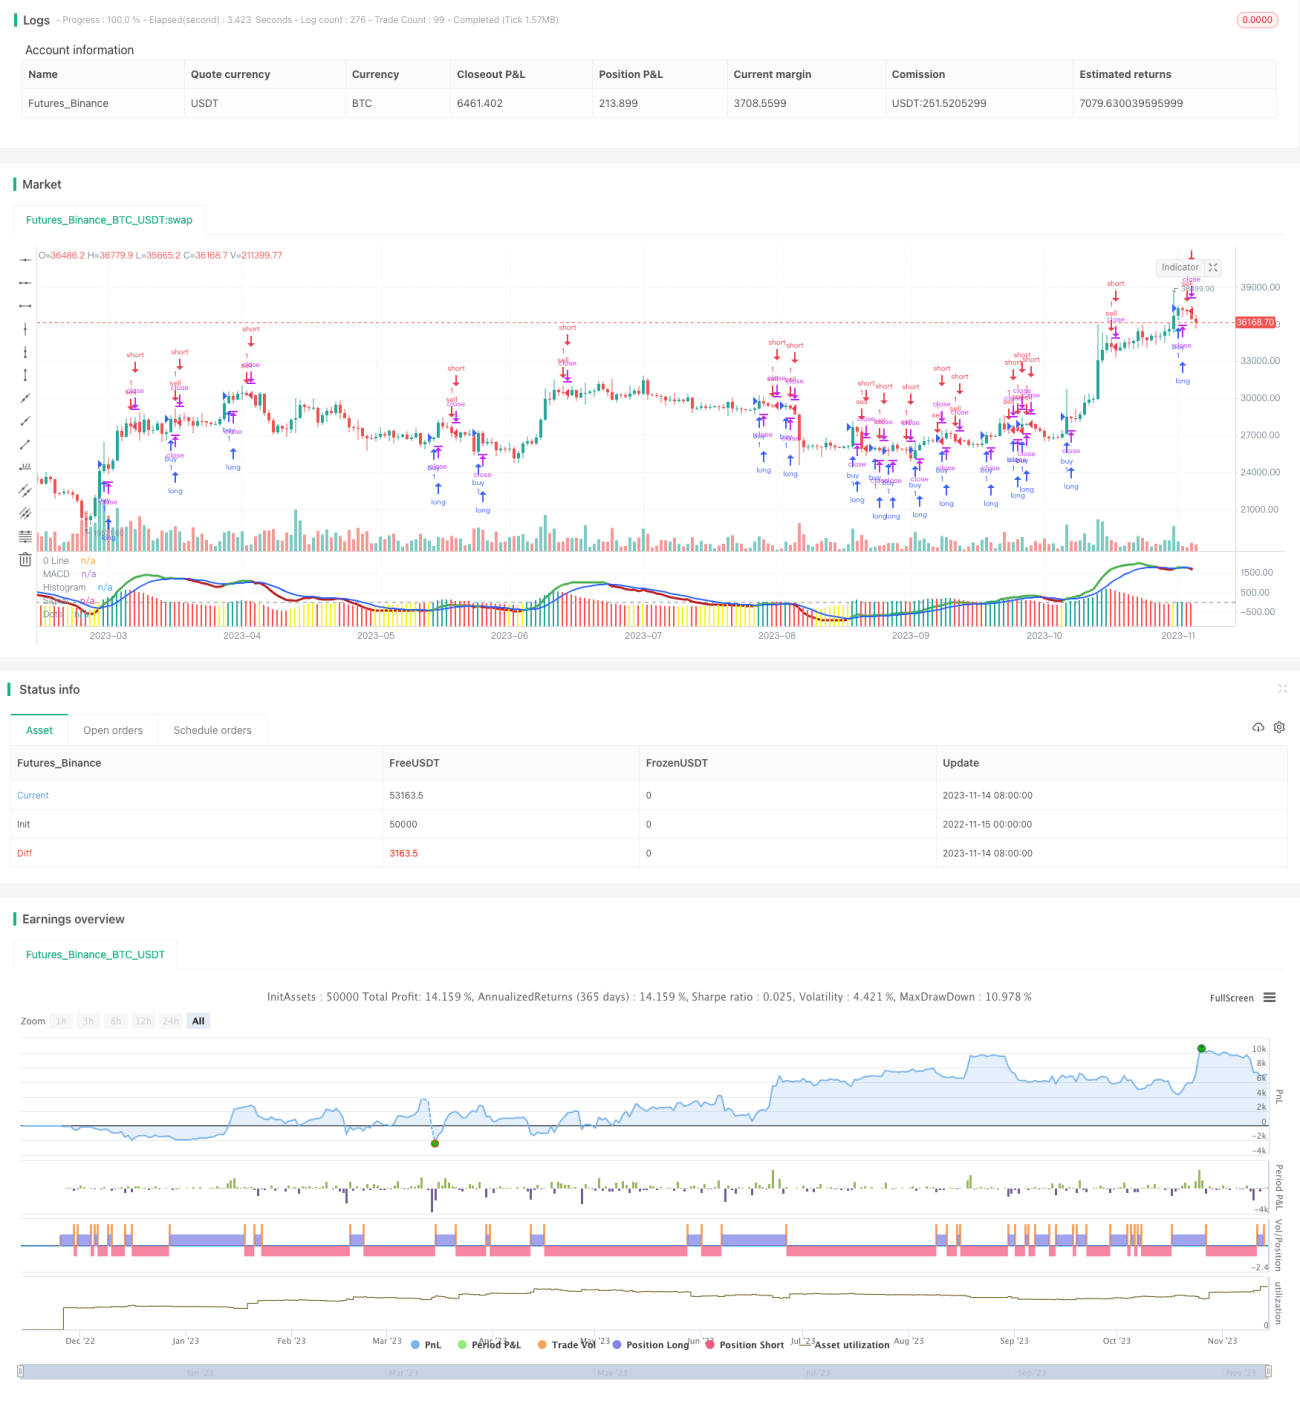
전략 소스 코드
/*backtest
start: 2022-11-15 00:00:00
end: 2023-11-15 00:00:00
period: 1d
basePeriod: 1h
exchanges: [{"eid":"Futures_Binance","currency":"BTC_USDT"}]
*/

//@version=5
strategy(title="Histogram MacD MVP_V2.1", shorttitle="Histogram MacD MVP_2.1")
//Plot Inputs
res           = input.timeframe("",  "Indicator TimeFrame")
fast_length   = input.int(title="Fast Length", defval=12)
slow_length   = input.int(title="Slow Length", defval=26)
src           = input.source(title="Source", defval=close)
signal_length = input.int(title="Signal Smoothing", minval = 1, maxval = 999, defval = 9)
sma_source    = input.string(title="Oscillator MA Type", defval="EMA", options=["SMA", "EMA"])
sma_signal    = input.string(title="Signal Line MA Type", defval="EMA", options=["SMA", "EMA"])
// Show Plots T/F
show_macd     = input.bool(true, title="Show MACD Lines", group="Show Plots?", inline="SP10")
show_macd_LW  = input.int(3, minval=0, maxval=5, title = "MACD Width", group="Show Plots?", inline="SP11")
show_signal_LW= input.int(2, minval=0, maxval=5, title = "Signal Width", group="Show Plots?", inline="SP11")
show_Hist     = input.bool(true, title="Show Histogram", group="Show Plots?", inline="SP20")
show_hist_LW  = input.int(5, minval=0, maxval=5, title = "-- Width", group="Show Plots?", inline="SP20")
show_trend    = input.bool(true, title = "Show MACD Lines w/ Trend Color", group="Show Plots?", inline="SP30")
show_HB       = input.bool(false, title="Show Highlight Price Bars", group="Show Plots?", inline="SP40")
show_cross    = input.bool(false, title = "Show BackGround on Cross", group="Show Plots?", inline="SP50")
show_dots     = input.bool(true, title = "Show Circle on Cross", group="Show Plots?", inline="SP60")
show_dots_LW  = input.int(5, minval=0, maxval=5, title = "-- Width", group="Show Plots?", inline="SP60")

//show_trend    = input(true, title = "Colors MACD Lines w/ Trend Color", group="Show Plots?", inline="SP5")
// MACD Lines colors
col_macd      = input.color(#FF6D00, "MACD Line  ",  group="Color Settings", inline="CS1")
col_signal    = input.color(#2962FF, "Signal Line  ",  group="Color Settings", inline="CS1")
col_trnd_Up   = input.color(#4BAF4F, "Trend Up      ",  group="Color Settings", inline="CS2")
col_trnd_Dn   = input.color(#B71D1C, "Trend Down    ",  group="Color Settings", inline="CS2")
// Histogram Colors
col_grow_above = input.color(#26A69A, "Above   Grow",  group="Histogram Colors", inline="Hist10")
col_fall_above = input.color(#FF5252, "Fall",  group="Histogram Colors", inline="Hist10")
col_grow_below = input.color(#FF5252, "Below Grow",  group="Histogram Colors", inline="Hist20")
col_fall_below = input.color(#f8f524, "Fall",  group="Histogram Colors", inline="Hist20")
// Alerts T/F Inputs
alert_Long    = input.bool(true, title = "MACD Cross Up", group = "Alerts", inline="Alert10")
alert_Short   = input.bool(true, title = "MACD Cross Dn", group = "Alerts", inline="Alert10")
alert_Long_A  = input.bool(false, title = "MACD Cross Up & > 0", group = "Alerts", inline="Alert20")
alert_Short_B = input.bool(false, title = "MACD Cross Dn & < 0", group = "Alerts", inline="Alert20")
// Calculating
fast_ma = request.security(syminfo.tickerid, res, sma_source == "SMA" ? ta.sma(src, fast_length) : ta.ema(src, fast_length))
slow_ma = request.security(syminfo.tickerid, res, sma_source == "SMA" ? ta.sma(src, slow_length) : ta.ema(src, slow_length))
macd = fast_ma - slow_ma
signal = request.security(syminfo.tickerid, res, sma_signal == "SMA" ? ta.sma(macd, signal_length) : ta.ema(macd, signal_length))
hist = macd - signal
// MACD Trend and Cross Up/Down conditions
trend_up   = macd > signal
trend_dn   = macd < signal
cross_UP   = signal[1] >= macd[1] and signal < macd
cross_DN   = signal[1] <= macd[1] and signal > macd
cross_UP_A = (signal[1] >= macd[1] and signal < macd) and macd > 0
cross_DN_B = (signal[1] <= macd[1] and signal > macd) and macd < 0
// Condition that changes Color of MACD Line if Show Trend is turned on..
trend_col = show_trend  and trend_up ? col_trnd_Up : trend_up ? col_macd : show_trend  and trend_dn ? col_trnd_Dn: trend_dn ? col_macd : na 

//Var Statements for Histogram Color Change
var bool histA_IsUp = false
var bool histA_IsDown = false
var bool histB_IsDown = false
var bool histB_IsUp = false
histA_IsUp   := hist == hist[1] ? histA_IsUp[1] : hist > hist[1] and hist > 0
histA_IsDown := hist == hist[1] ? histA_IsDown[1] : hist < hist[1] and hist > 0
histB_IsDown := hist == hist[1] ? histB_IsDown[1] : hist < hist[1] and hist <= 0
histB_IsUp   := hist == hist[1] ? histB_IsUp[1] : hist > hist[1] and hist <= 0

hist_col =  histA_IsUp ? col_grow_above : histA_IsDown ? col_fall_above : histB_IsDown ? col_grow_below : histB_IsUp ? col_fall_below :color.silver 

// Plot Statements
//Background Color
bgcolor(show_cross and cross_UP ? col_trnd_Up : na, editable=false)
bgcolor(show_cross and cross_DN ? col_trnd_Dn : na, editable=false)
//Highlight Price Bars
barcolor(show_HB and trend_up ? col_trnd_Up : na, title="Trend Up", offset = 0, editable=false)
barcolor(show_HB and trend_dn ? col_trnd_Dn : na, title="Trend Dn", offset = 0, editable=false)
//Regular Plots
plot(show_Hist and hist ? hist : na, title="Histogram", style=plot.style_columns, color=color.new(hist_col ,0),linewidth=show_hist_LW)
plot(show_macd  and signal ? signal : na, title="Signal", color=color.new(col_signal, 0),  style=plot.style_line ,linewidth=show_signal_LW)
plot(show_macd  and macd ? macd : na, title="MACD", color=color.new(trend_col, 0),  style=plot.style_line ,linewidth=show_macd_LW)
hline(0, title="0 Line", color=color.new(color.gray, 0), linestyle=hline.style_dashed, linewidth=1, editable=false)
plot(show_dots and cross_UP ? macd : na, title="Dots", color=color.new(trend_col ,0), style=plot.style_circles, linewidth=show_dots_LW, editable=false)
plot(show_dots and cross_DN ? macd : na, title="Dots", color=color.new(trend_col ,0), style=plot.style_circles, linewidth=show_dots_LW, editable=false)

//Alerts
if alert_Long and cross_UP
    alert("Symbol = (" + syminfo.tickerid + ") TimeFrame = (" + timeframe.period + ") Current Price (" + str.tostring(close) + ") MACD Crosses Up.", alert.freq_once_per_bar_close)

if alert_Short and cross_DN
    alert("Symbol = (" + syminfo.tickerid + ") TimeFrame = (" + timeframe.period + ") Current Price (" + str.tostring(close) + ") MACD Crosses Down.", alert.freq_once_per_bar_close)
//Alerts - Stricter Condition - Only Alerts When MACD Crosses UP & MACD > 0 -- Crosses Down & MACD < 0
if alert_Long_A and cross_UP_A
    alert("Symbol = (" + syminfo.tickerid + ") TimeFrame = (" + timeframe.period + ") Current Price (" + str.tostring(close) + ") MACD > 0 And Crosses Up.", alert.freq_once_per_bar_close)

if alert_Short_B and cross_DN_B
    alert("Symbol = (" + syminfo.tickerid + ") TimeFrame = (" + timeframe.period + ") Current Price (" + str.tostring(close) + ") MACD < 0 And Crosses Down.", alert.freq_once_per_bar_close)


if (histA_IsUp)
	strategy.entry("buy", strategy.long, comment="buy")
if (histA_IsDown)
	strategy.entry("sell", strategy.short, comment="sell")