더블 이동 평균 교차 반전 전략

1
Follow
1778
Followers
개요
이 전략의 주요 아이디어는 빠른 이동 평균 선과 느린 이동 평균 선의 교차를 사용하여 시장 추세를 판단하고 짧은 선과 긴 이동 평균 선이 반전 할 때 진입하여 추세를 추적하는 효과를 달성하는 것입니다.
전략 원칙
- 빠른 이동 평균 주기를 설정 shortma (기본 7일) 그리고 느린 이동 평균 주기를 longma (기본 77일)
- 짧은 선이 평균선 위에 긴 선을 통과하면 구매 신호로 판단하고, barssince (mabuy) 로 기록하며, 긴 선은 트렌드에 들어가는 것을 의미한다. 짧은 선이 평균선 아래에 긴 선을 통과하면 판매 신호로 판단하고, barssince (masell) 로 기록하고, 긴 선은 트렌드 종료를 의미한다.
- barssince의 크기를 비교하면, 상향으로 가로질러 있는 짧은 평균 선의 바 수가 많을수록 트렌드가 지속되는 시간이 길다는 것을 나타냅니다. 반대로, 상향으로 가로질러 있는 짧은 평균 선의 <unk> 수가 많을수록 역전 신호가 강하다는 것을 나타냅니다.
- 판매 신호의 바 수가 구매 신호의 바 수보다 많을 때 구매 신호를 발신한다. 구매 신호의 바 수가 판매 신호의 바 수보다 많을 때 판매 신호를 발신한다.
- such 전략은 본질적으로 양평선 반전 전략으로, 빠른 평균선과 느린 평균선의 반전으로 트렌드 전환점을 판단합니다.
전략적 이점
- 이중 평형 판단을 사용하여 일부 잡음 거래 신호를 필터링합니다.
- barssince 비교를 추가하고, False Break과 Close 반전으로 인한 잘못된 신호를 피합니다.
- 이해하기 쉽고 실행 가능
- 사용자 정의 이동 평균 변수, 다른 주기 및 시장에 적용
전략적 위험
- 이중 평행 전략은 더 많은 신호를 생성하고 거래가 더 자주 발생합니다.
- 이동 평균 선 변수를 잘못 설정하면 더 긴 트렌드 기회를 놓칠 수 있습니다.
- 장기 평균선을 돌파할 때, 정지점은 멀리 떨어져 있을 수 있고, 큰 회귀가 있을 수 있습니다.
- 하지만, 이 시장의 흐름은 매우 복잡합니다.
전략 최적화 방향
- 다른 지표들을 필터링하여, 흔들림의 속박을 피하십시오.
- 손해 방지 장치
- 이동 평균선 변수 모음 최적화
- 시장주기 역동에 따라 조정된 이동평균선 파라미트
요약하다
이 전략은 전체적으로 논리적으로 명확하고 이해하기 쉽다. 빠른 평균선과 느린 평균선 역전으로 시장 추세 전환점을 판단하여 이론적으로 유행을 효과적으로 추적할 수 있다. 그러나 실제 적용에서는 전략 알고리즘 자체와 파라미터 설정을 최적화하여 더 안정적이고 실전적으로 만들 필요가 있다.
Source
Pine
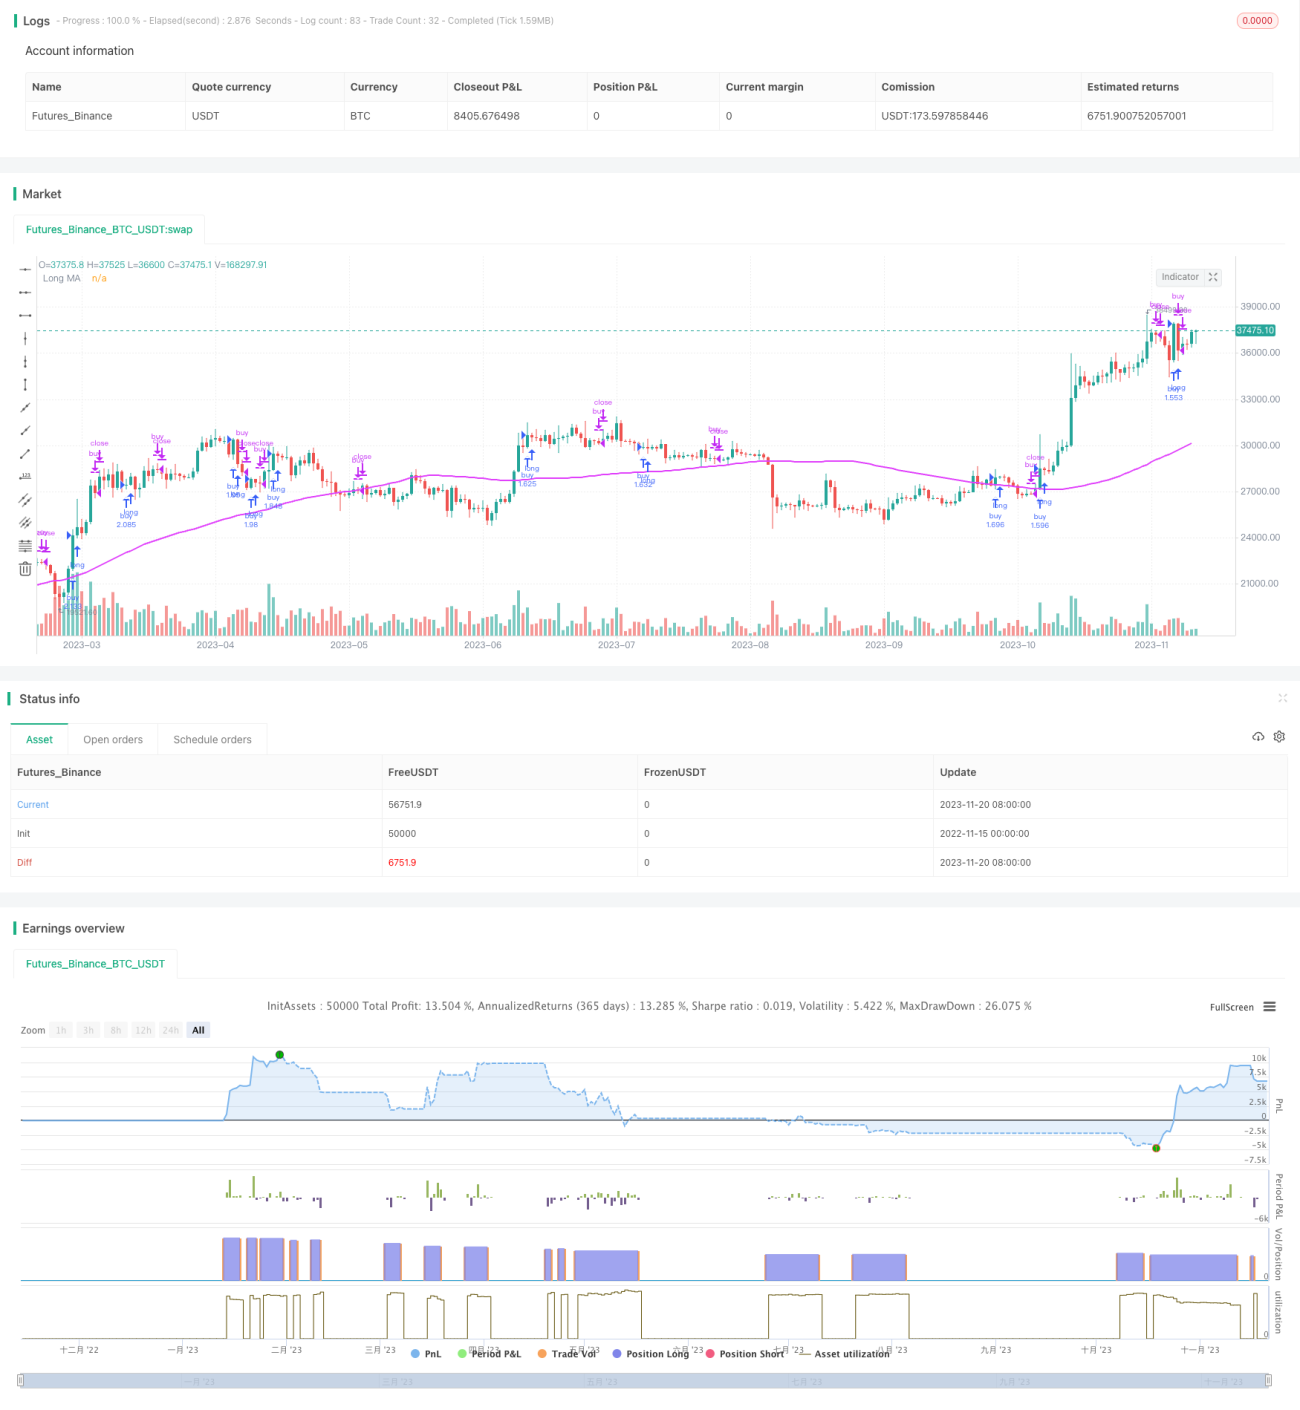
/*backtest
start: 2022-11-15 00:00:00
end: 2023-11-21 00:00:00
period: 1d
basePeriod: 1h
exchanges: [{"eid":"Futures_Binance","currency":"BTC_USDT"}]
*/

//@version=3
strategy("Up Down", "Up Down", precision = 6, pyramiding = 1, default_qty_type = strategy.percent_of_equity, default_qty_value = 99, commission_type = strategy.commission.percent, commission_value = 0.0, initial_capital = 1000, overlay = true)

buy = close > open and open > close[1]Strategy parameters
Related strategies
Comment
All comments (0)
No data
- 1