볼린저 밴드 골든 크로스와 데드 크로스 전략


생성 날짜: 2023-11-23 14:01:57 마지막으로 수정됨: 2023-11-23 14:01:57
복사: 0 클릭수: 548
avatar of ChaoZhang ChaoZhang
1
집중하다
1617
수행원

볼린저 밴드 골든 크로스와 데드 크로스 전략

개요

이 전략은 부린 띠에 기반한 금叉死叉 (金叉死叉) 의 더 많은 코오피를 하는 전략이다. 가격이 부린 띠를 뚫고 궤도에 올랐을 때, 코오피를 한다. 가격이 부린 띠를 뚫고 궤도에 내려갈 때, 더 많이 한다. 포지션을 보유하는 동안, 포지션이 추가되고 손실 추적이 이루어진다.

전략 원칙

이 전략은 부린띠의 위와 아래 3개의 궤도를 사용한다. 부린띠의 중궤도는 n일의 이동 평균이며, 상궤도는 중궤도+k배의 n일의 표준차이고, 하궤도는 중궤도-k배의 n일의 표준차이다. n은 일반적으로 20이고, k는 일반적으로 2이다.

가격이 하향으로 하향을 돌파하면 가격이 상승하기 시작한다는 것을 나타냅니다. 이 때 더 많이하십시오. 가격이 상향으로 하향으로 하향을 돌파하면 가격이 떨어지기 시작한다는 것을 나타냅니다. 이 때 공백하십시오.

상쇄된 후에, 상쇄된 포지션의 조건은 이미 보유한 포지션의 기초이며, 가격이 다시 평균선을 만지면, 다시 포지션을 상쇄하거나 상쇄한다.

모든 포지션의 스톱로스 추적도 실시간으로 업데이트된다. 스톱로스 라인은 현재 포지션의 평균 가격과 브린 벨트 가격의 차이에 따라 설정된다.

우위 분석

이 전략은 다음과 같은 장점을 가지고 있습니다.

  1. 브린 벨트 지표를 사용하여 가격 돌파구를 포착하고, 더 많은 공백을 정확하게 수행합니다.
  2. 골드 포크 (Gold Fork) 방식의 정규화된 입학
  3. 지분을 보유하면 더 많은 수익을 얻을 수 있습니다.
  4. 정지 손실을 실시간으로 업데이트하여 정지 손실을 방지합니다.

위험 분석

이 전략에는 몇 가지 위험도 있습니다.

  1. 브린 띠는 지표로서 시장의 변동에 민감하며, 중매가 될 수 있습니다.
  2. 가축화 방식은 위험을 증가시키고, 손실을 확대합니다.
  3. “피해 경계는 절대적이지 않다”는 주장을 지지하고 있는 “피해 경계는 절대적이지 않다”는 주장을 지지하고 있는 “피해 경계는 절대적이지 않다”.

이러한 위험에는 다음과 같은 측면에서 최적화할 수 있습니다.

  1. 브린띠의 변수를 조정하여 다른 주기에 맞게 조정
  2. 가설의 규모와 빈도를 최적화
  3. 중간 선로를 추가하여 추가로 막는 선

최적화 방향

이 전략은 다음과 같은 부분에서 최적화될 수 있습니다.

  1. 부린 띠의 매개 변수를 최적화하여 더 많은 시장 환경에 적응합니다.
  2. 리스크와 수익을 균형 잡는 포장 논리를 최적화합니다.
  3. 중간 경로 상쇄와 같은 상쇄선을 추가
  4. 더 많은 방치 전략, 더 많은 방치 활동
  5. 다른 지표와 함께 출전 시간을 필터링합니다.
  6. 자금 관리를 최적화하고 단편적 위험을 통제합니다.

요약하다

이 전략은 전체적으로 전형적인 트렌드 추적 전략이다. 그것은 순차적으로 트렌드가 나타나면 수익을 얻을 수 있다. 동시에, 약간의 위험이 있으며, 더 많은 시장 상황에 적응하고 가짜 돌파구로 인한 위험을 줄이기 위해 추가 최적화 및 개선이 필요합니다.
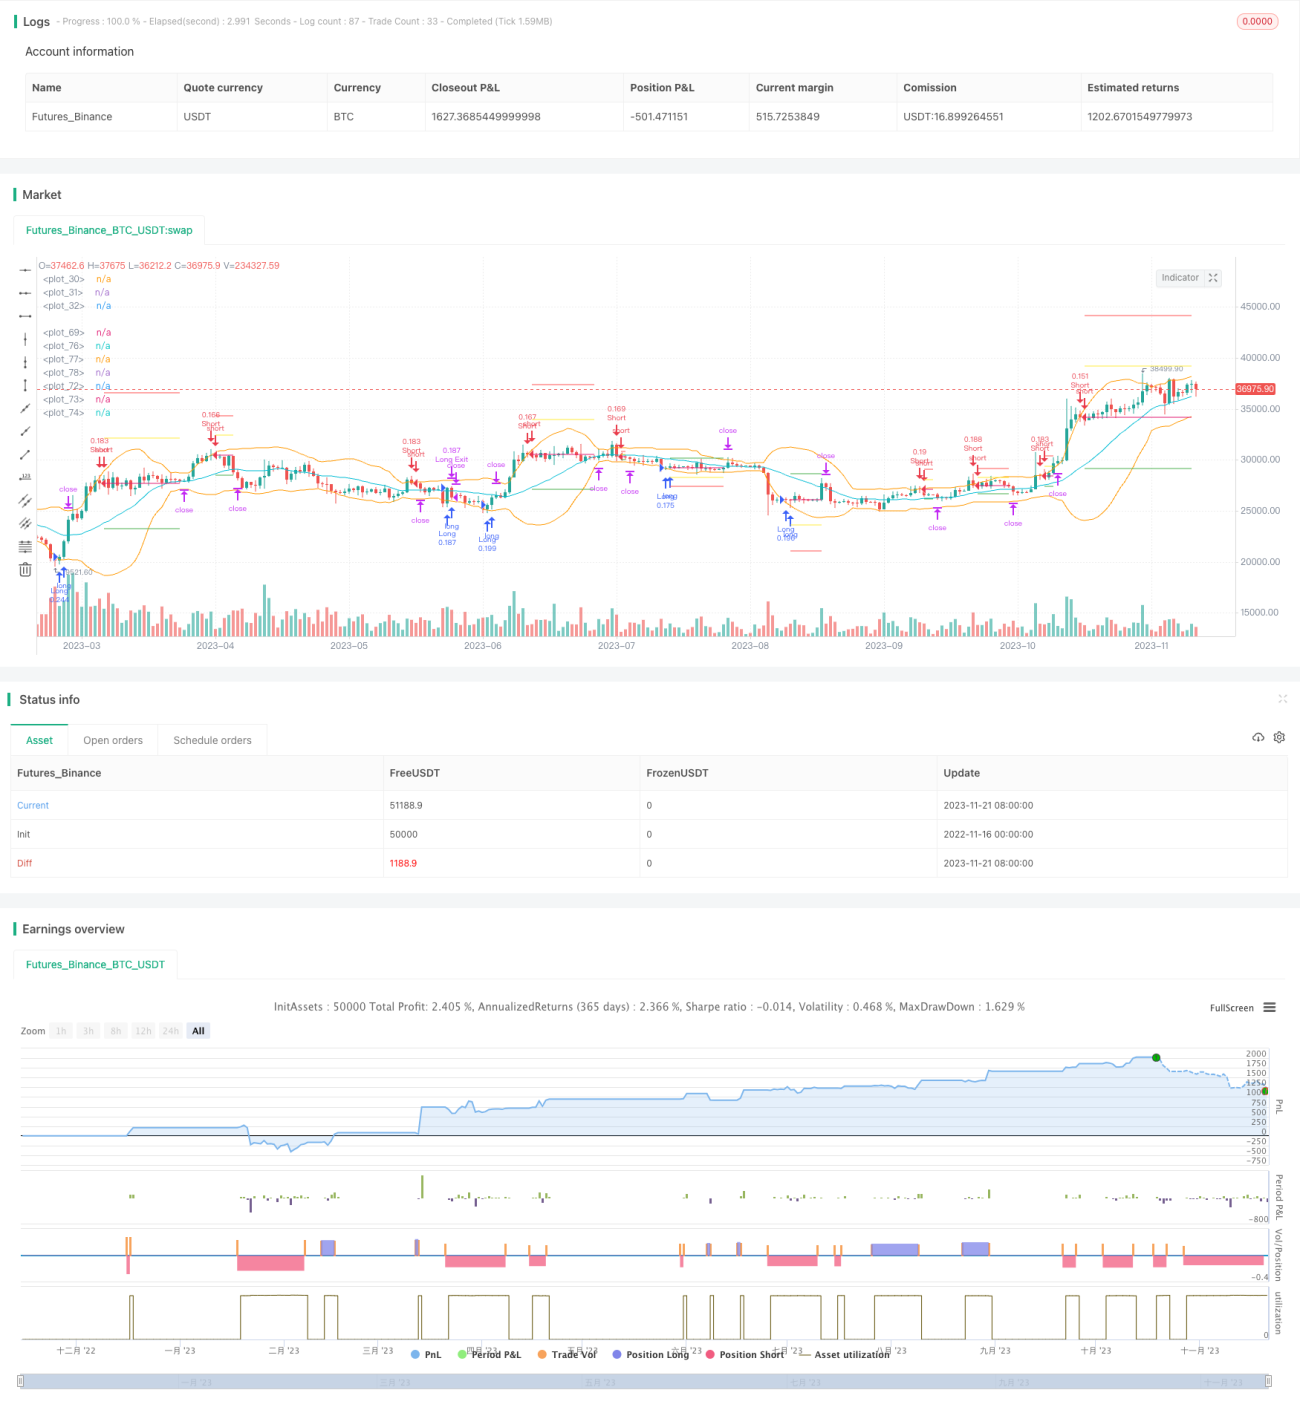
전략 소스 코드
/*backtest
start: 2022-11-16 00:00:00
end: 2023-11-22 00:00:00
period: 1d
basePeriod: 1h
exchanges: [{"eid":"Futures_Binance","currency":"BTC_USDT"}]
*/

//@version=5

strategy(title='Bollinger Band strategy with split, limit, stop', shorttitle='bb strategy', overlay=true,commission_type = strategy.commission.percent, commission_value = 0.01, default_qty_type = strategy.percent_of_equity, default_qty_value = 10, pyramiding = 4)


//Summary: Going Long or Short when Entering after Breaking the Bollinger Bands\
//At this time, the stop-loss, profit-taking price, and pyramiding standard\
// are determined from the difference between the position average price and the band price.

//After entering the position, if the price crosses the mid-band line, the stop loss is adjusted to the mid-band line.


//each trade, entry position size = 10% of total cash
//max pyramiding is 4
//commission = 0.01%


in_period = true


bb_length = input.int(20)
bb_mult = input.int(2)

[middle, upper, lower] = ta.bb(close,bb_length, bb_mult)
plot(middle, color=color.aqua)
plot(upper, color=color.orange)
plot(lower, color=color.orange)
long_cond = ta.crossover(close,lower)
short_cond = ta.crossunder(close,upper)

var saved_ph = 0.0
if strategy.opentrades>0 and strategy.opentrades[1]==0 and strategy.position_size > 0
    saved_ph := upper[1]
var saved_pl = 0.0
if strategy.opentrades>0 and strategy.opentrades[1]==0 and strategy.position_size < 0
    saved_pl := lower[1]

avg = strategy.position_avg_price

long_diff = saved_ph-avg
short_diff = saved_pl-avg

long_stoploss = avg - 1*long_diff
short_stoploss = avg - 1*short_diff

long_avgdown = avg - 0.5*long_diff
short_avgup = avg - 0.5*short_diff

long_profit_price = avg + 0.5*long_diff
short_profit_price = avg + 0.5*short_diff

var label _label = na
if in_period
    if long_cond and strategy.opentrades==0
        strategy.entry("Long",strategy.long)
    if long_cond and strategy.opentrades >0 and (close[1]<long_avgdown or close[2]<long_avgdown)
        strategy.entry("Long",strategy.long)

    if short_cond and strategy.opentrades==0
        strategy.entry("Short", strategy.short)
    if short_cond and strategy.opentrades>0 and (close[1]>short_avgup or close[2]>short_avgup)
        strategy.entry("Short",strategy.short)

plot(avg, style=plot.style_linebr)


plot(strategy.position_size > 0? long_profit_price: na,color=color.green, style=plot.style_linebr)
plot(strategy.position_size > 0? long_avgdown: na,color=color.yellow, style=plot.style_linebr)
plot(strategy.position_size > 0? long_stoploss: na,color=color.red, style=plot.style_linebr)

plot(strategy.position_size < 0? short_profit_price: na,color=color.green, style=plot.style_linebr)
plot(strategy.position_size < 0? short_avgup: na,color=color.yellow, style=plot.style_linebr)
plot(strategy.position_size < 0? short_stoploss: na,color=color.red, style=plot.style_linebr)

if strategy.position_size > 0
    if ta.crossover(close, middle)
        strategy.exit("Long Exit", "Long", limit=long_profit_price, stop=middle)
    else
        strategy.exit("Long Exit", "Long", limit=long_profit_price, stop=long_stoploss)
if strategy.position_size < 0
    if ta.crossunder(close, middle)
        strategy.exit("Short Exit", "Short", limit=short_profit_price, stop=middle)
    else
        strategy.exit("Short Exit", "Short", limit=short_profit_price, stop=short_stoploss)