
이 전략은 여러 가지 기술 지표를 통합하여 동력 반전과 쌍용 레일 배치를 구현하여 거래 신호를 형성한다. 이 전략은 123 형태 판단 반전 지점을 사용하여 에르고딕 CSI 지표와 배합 신호를 형성하여 트렌드 추적을 구현한다. 이 전략은 중단선 트렌드를 포착하여 더 높은 수익을 얻으려고 한다.
이 전략은 두 부분으로 구성되어 있습니다.
123 형식 판단은 최근 3 K 선의 종결 가격 관계를 통해 가격 반전을 판단하는 것이다. 구체적인 판단 논리는 다음과 같다: 만약 K선 앞뒤의 1개가 상승하고, 현재 H&M Stoch 지표가 모두 50보다 낮다면, 구매 신호이다. 만약 앞의 두 K 라인 후의 종결값이 하락하고, 현재 빠른 느린 스토치 지표가 모두 50보다 높다면, 팔기 위한 신호이다.
ergodic CSI 지표는 가격, 실제 파도, 트렌드 지표 등의 여러 요소를 고려하여 시장의 흐름을 종합적으로 판단하여 구매 및 판매 지역을 생성한다. 지표가 구매 영역보다 높을 때 구매 신호가 발생하고 판매 영역보다 낮을 때 판매 신호가 발생한다.
마지막으로, 123 형태의 역전 신호는 에르고딕 CSI의 궤도 신호와 대 연산을 하여 최종 전략 신호를 얻는다.
이 전략은 반전형태와 이중 궤도와 결합하여 중·중간 단선 트렌드를 효과적으로 추적한다. 단일 기술 지표에 비해 더 높은 안정성과 수익 수준을 가지고 있다. 다음 단계는 파라미터를 더욱 최적화하고, 손실을 멈추고 주식을 선택하는 모듈을 추가하여 철회량을 줄이고, 전체 효과를 높인다.
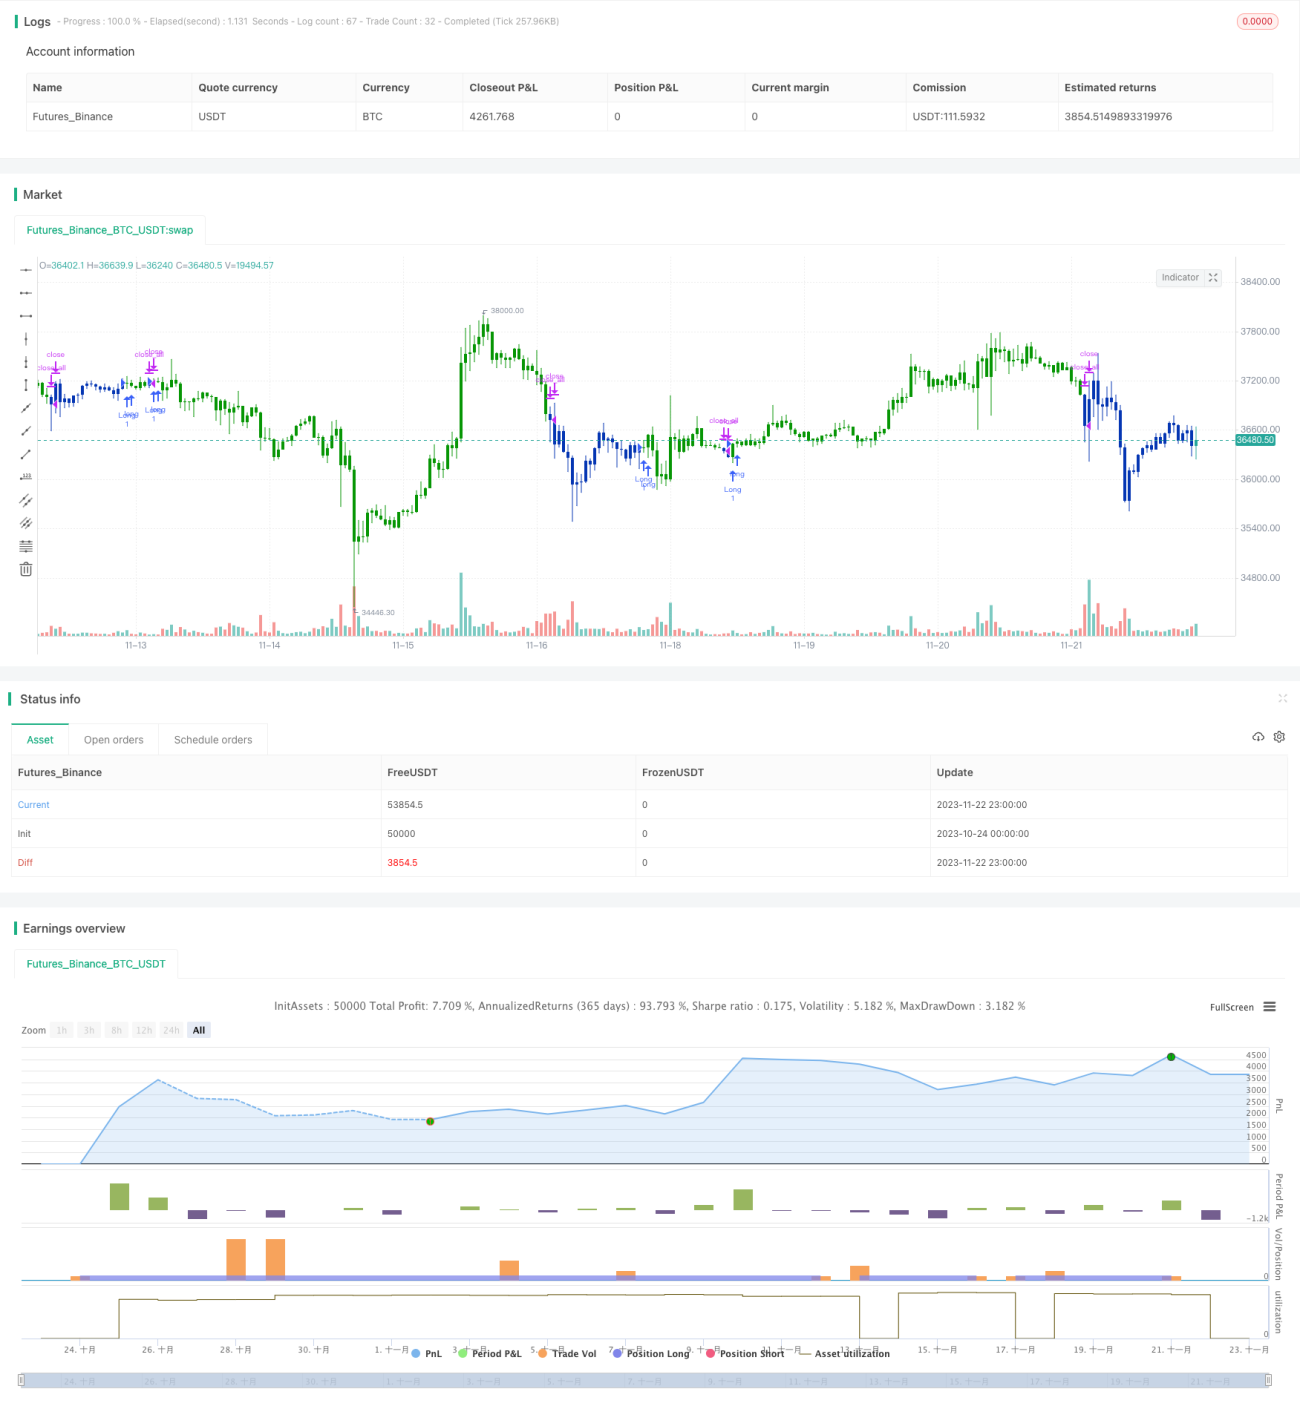
/*backtest
start: 2023-10-24 00:00:00
end: 2023-11-23 00:00:00
period: 1h
basePeriod: 15m
exchanges: [{"eid":"Futures_Binance","currency":"BTC_USDT"}]
*/
//@version=4
////////////////////////////////////////////////////////////
// Copyright by HPotter v1.0 22/07/2020
// This is combo strategies for get a cumulative signal.
//
// First strategy
// This System was created from the Book "How I Tripled My Money In The
// Futures Market" by Ulf Jensen, Page 183. This is reverse type of strategies.
// The strategy buys at market, if close price is higher than the previous close
// during 2 days and the meaning of 9-days Stochastic Slow Oscillator is lower than 50.
// The strategy sells at market, if close price is lower than the previous close price
// during 2 days and the meaning of 9-days Stochastic Fast Oscillator is higher than 50.
//
// Second strategy
// This is one of the techniques described by William Blau in his book
// "Momentum, Direction and Divergence" (1995). If you like to learn more,
// we advise you to read this book. His book focuses on three key aspects
// of trading: momentum, direction and divergence. Blau, who was an electrical
// engineer before becoming a trader, thoroughly examines the relationship between
// price and momentum in step-by-step examples. From this grounding, he then looks
// at the deficiencies in other oscillators and introduces some innovative techniques,
// including a fresh twist on Stochastics. On directional issues, he analyzes the
// intricacies of ADX and offers a unique approach to help define trending and
// non-trending periods.
// This indicator plots Ergotic CSI and smoothed Ergotic CSI to filter out noise.
//
// WARNING:
// - For purpose educate only
// - This script to change bars colors.
////////////////////////////////////////////////////////////
Reversal123(Length, KSmoothing, DLength, Level) =>
vFast = sma(stoch(close, high, low, Length), KSmoothing)
vSlow = sma(vFast, DLength)
pos = 0.0
pos := iff(close[2] < close[1] and close > close[1] and vFast < vSlow and vFast > Level, 1,
iff(close[2] > close[1] and close < close[1] and vFast > vSlow and vFast < Level, -1, nz(pos[1], 0)))
pos
fADX(Len) =>
up = change(high)
down = -change(low)
trur = rma(tr, Len)
plus = fixnan(100 * rma(up > down and up > 0 ? up : 0, Len) / trur)
minus = fixnan(100 * rma(down > up and down > 0 ? down : 0, Len) / trur)
sum = plus + minus
100 * rma(abs(plus - minus) / (sum == 0 ? 1 : sum), Len)
ECSI(r,Length,BigPointValue,SmthLen,SellZone,BuyZone) =>
pos = 0
source = close
K = 100 * (BigPointValue / sqrt(r) / (150 + 5))
xTrueRange = atr(1)
xADX = fADX(Length)
xADXR = (xADX + xADX[1]) * 0.5
nRes = iff(Length + xTrueRange > 0, K * xADXR * xTrueRange / Length,0)
xCSI = iff(close > 0, nRes / close, 0)
xSMA_CSI = sma(xCSI, SmthLen)
pos := iff(xSMA_CSI > BuyZone, 1,
iff(xSMA_CSI <= SellZone, -1, nz(pos[1], 0)))
pos
strategy(title="Combo Backtest 123 Reversal & Ergodic CSI", shorttitle="Combo", overlay = true)
Length = input(14, minval=1)
KSmoothing = input(1, minval=1)
DLength = input(3, minval=1)
Level = input(50, minval=1)
//-------------------------
r = input(32, minval=1)
LengthECSI = input(1, minval=1)
BigPointValue = input(1.0, minval=0.00001)
SmthLen = input(5, minval=1)
SellZone = input(0.06, minval=0.00001)
BuyZone = input(0.02, minval=0.001)
reverse = input(false, title="Trade reverse")
posReversal123 = Reversal123(Length, KSmoothing, DLength, Level)
posECSI = ECSI(r,LengthECSI,BigPointValue,SmthLen,SellZone,BuyZone)
pos = iff(posReversal123 == 1 and posECSI == 1 , 1,
iff(posReversal123 == -1 and posECSI == -1, -1, 0))
possig = iff(reverse and pos == 1, -1,
iff(reverse and pos == -1 , 1, pos))
if (possig == 1)
strategy.entry("Long", strategy.long)
if (possig == -1)
strategy.entry("Short", strategy.short)
if (possig == 0)
strategy.close_all()
barcolor(possig == -1 ? #b50404: possig == 1 ? #079605 : #0536b3 )