개요
이 전략은 다중 시간 프레임의 슈퍼 트렌드 지표와 부린 벨트 지표를 결합하여 트렌드 방향과 중요한 지지부진의 저항 지점을 식별하고, 충격이 돌파될 때 엔트리를 수행하고, 교차적 퇴출 포지션을 기반으로합니다. 이 전략은 주로 금, 은, 원유 등과 같은 변동성이 높은 상품 선물 품목에 적용됩니다.
전략 원칙
Pine Script을 기반으로 작성된 사용자 정의 다중 시간 프레임 슈퍼 트렌드 함수pine_supertrend(), 다른 주기 (예: 1분과 5분) 의 슈퍼 트렌드를 결합하여 대 주기 트렌드 방향을 판단한다.
동시에, 불린带上下轨计算,通道突破判斷. △값이 불린带上轨을 뚫을 때, 낙점적 돌파에 있다고 간주; △값이 불린带下轨를 뚫을 때, 하향적 돌파라고 간주.
전략적 신호:
다중 신호: 종전 가격 > 브린이 궤도에 올랐고 종전 가격 > 다중 시간 프레임 슈퍼 트렌드 지표 허공 신호: 종결 가격 < 브린의 하향 경로 및 종결 가격 < 다중 시간 프레임 슈퍼 트렌드 지표
손해배상:
다중 상위 손실: 종결 가격 < 5 분 슈퍼 트렌드 지표 공허 상위 상쇄: 종결 가격 > 5 분 슈퍼 트렌드 지표
따라서, 전략은 슈퍼 트렌드 지표와 부린 밴드 지표의 공명 돌파구를 포착하고, 높은 변동의 상황에서 거래를 처리한다.
우위 분석
- 다중 시간 프레임 슈퍼 트렌드 지표를 사용하여 대주기 트렌드 방향을 판단하여 신호 품질을 향상시킵니다.
- 부린은 선로 상하의 저항 지점의 핵심 지지를 담당하며, 허위 돌파를 줄일 수 있다.
- 슈퍼 트렌드 지표는 손실을 줄이고 위험을 통제하기 위해 중지 지점으로 사용됩니다.
위험 분석
- 수퍼 트렌드 지표의 지연성, 트렌드 전환점을 놓칠 수 있다
- 부린 밴드 파라미터를 잘못 설정하면 너무 자주 또는 너무 많은 거래가 발생할 수 있습니다.
- 상품 선물 밤 거래 또는 중요한 사건이 발생하면 가격이 급격하게 변동하여 손해를 쉽게 막을 수 있습니다.
위험 해결 방법:
- 여러 보조 지표 확인 신호와 함께 가짜 돌파를 방지합니다.
- 브린 벨트 변수를 최적화하여 최적의 균형을 찾습니다.
- 스톱 포지션을 조정하고 스톱 거리를 확장합니다.
최적화 방향
- KDJ, MACD와 같은 다른 트렌드 지표들을 보조적으로 사용해보세요.
- 기계 학습 모델의 판단 확률을 증가시키는 보조
- 변수 최적화를 수행하여 최적의 초변수 조합을 찾습니다.
요약하다
이 전략은 슈퍼 트렌드와 부린 띠의 두 가지 효율적인 지표를 통합하여 시간 프레임 분석과 통로 돌파 판단을 통해 높은 확률의 조작을 구현합니다. 전략은 자금 위험을 효과적으로 제어하고, 높은 변동성 품종에서 더 나은 수익을 얻을 수 있음을 확인합니다. 전략의 효과는 더 나은 최적화 및 INDICATORS 조합을 통해 향상 될 수 있습니다.
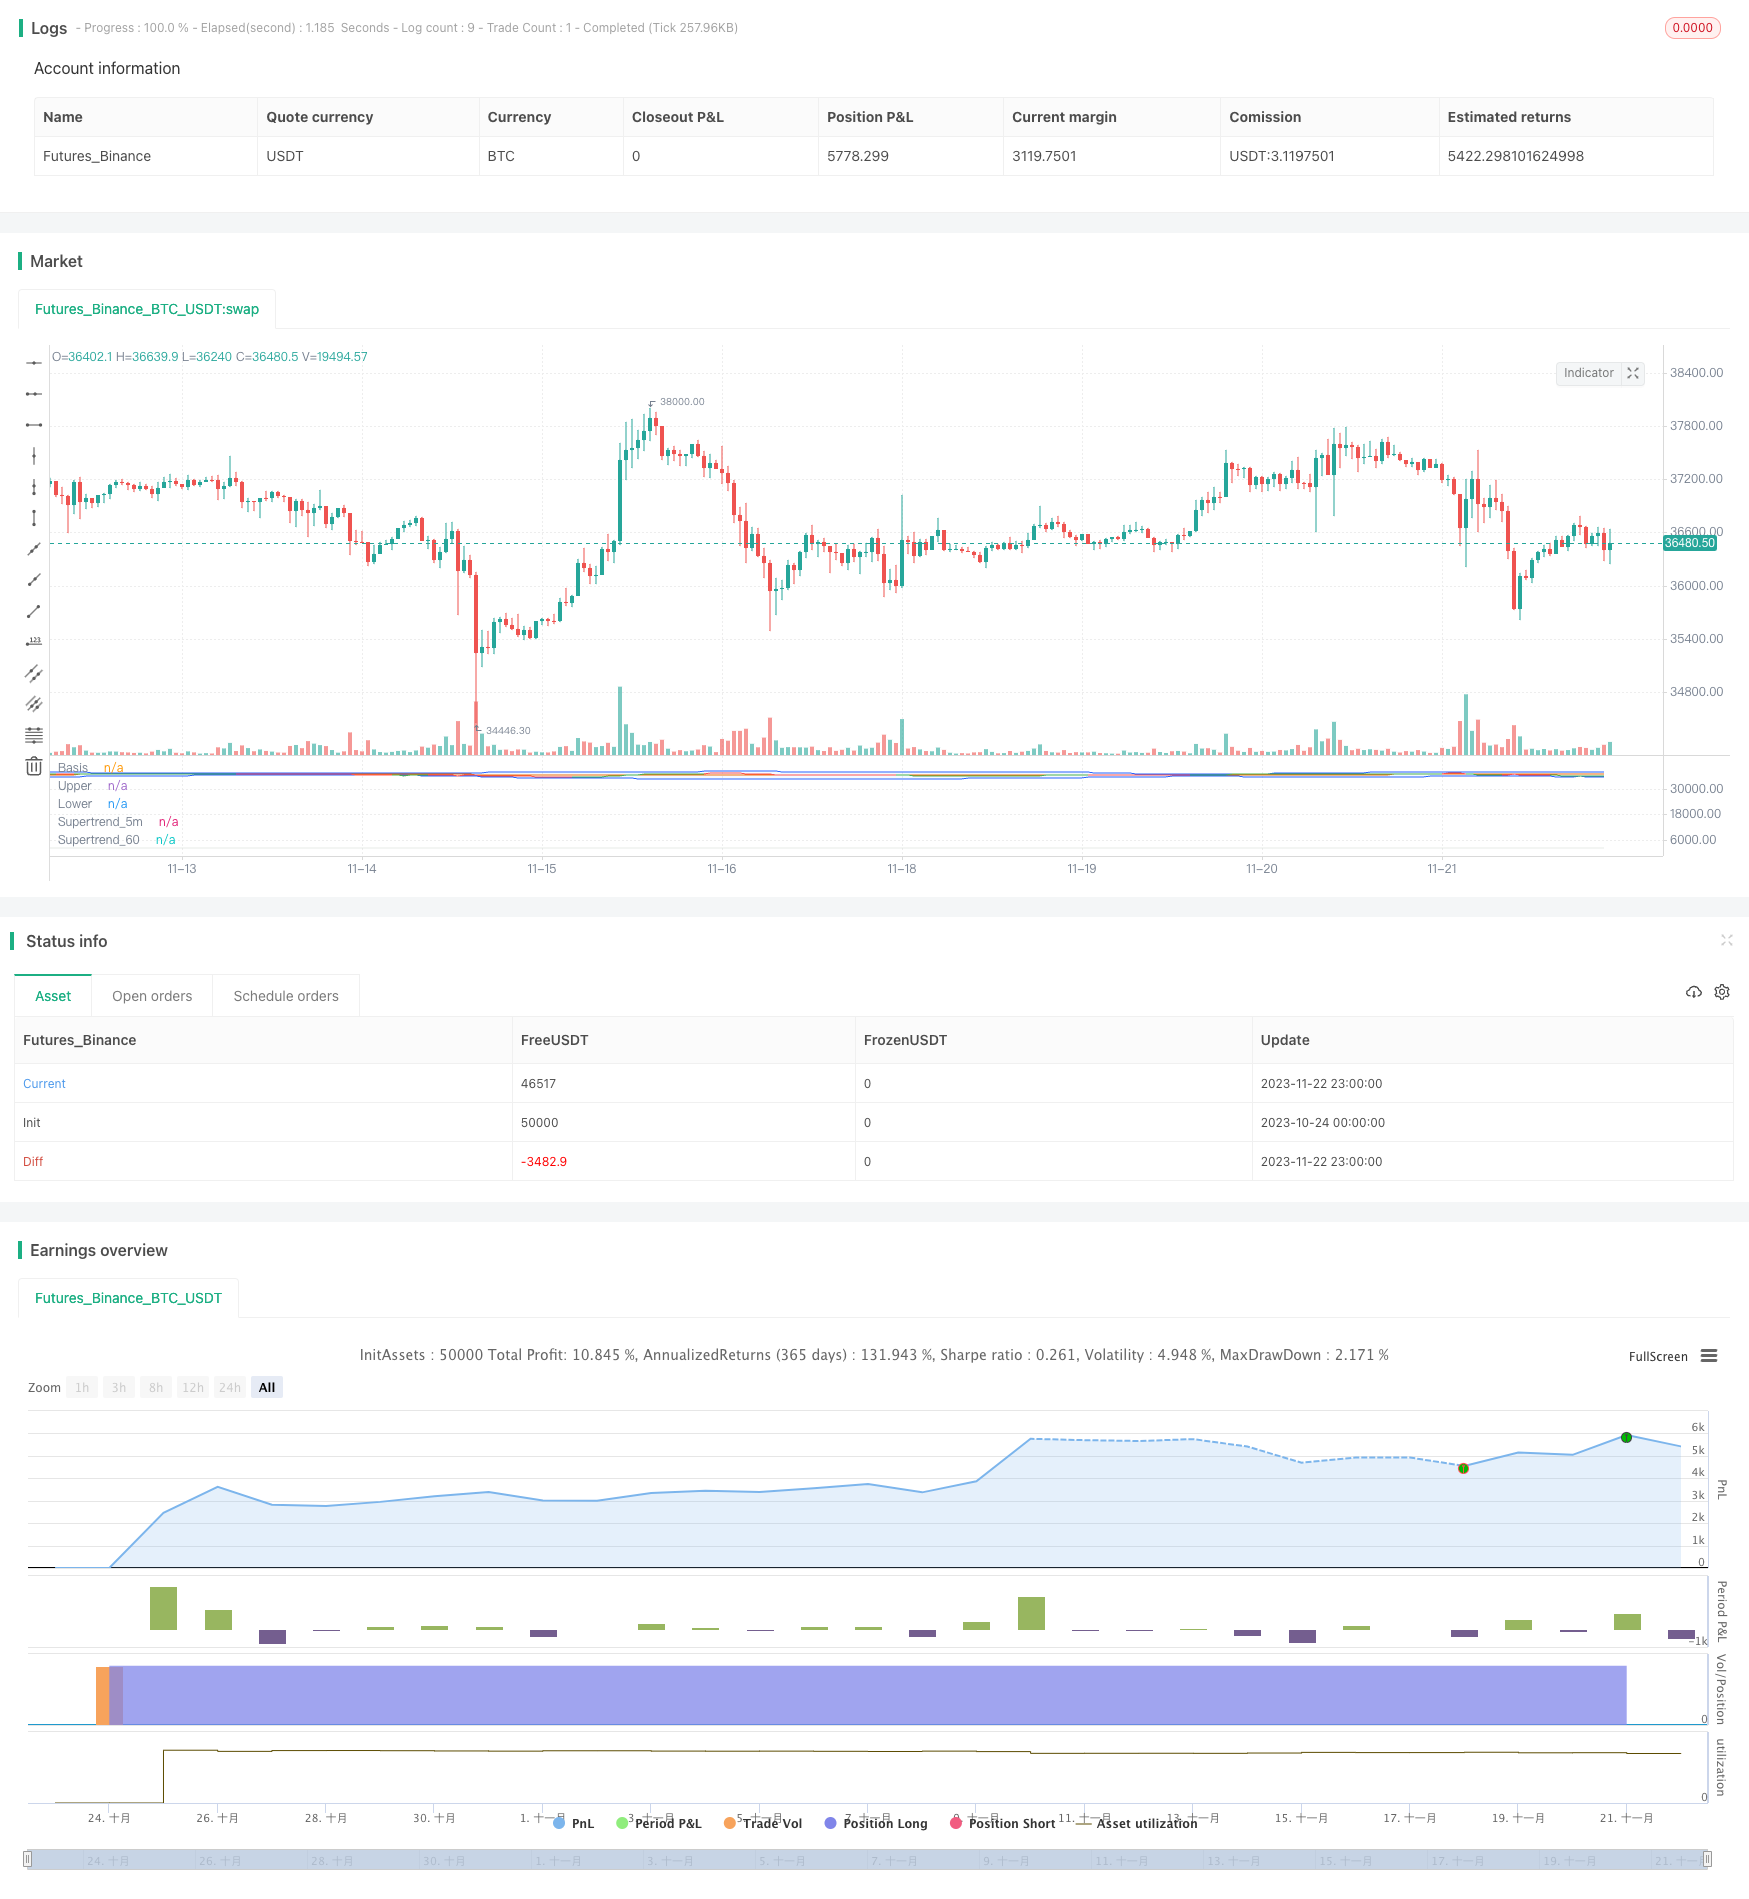
/*backtest
start: 2023-10-24 00:00:00
end: 2023-11-23 00:00:00
period: 1h
basePeriod: 15m
exchanges: [{"eid":"Futures_Binance","currency":"BTC_USDT"}]
*/

// This source code is subject to the terms of the Mozilla Public License 2.0 at https://mozilla.org/MPL/2.0/
// © ambreshc95

//@version=5
strategy("Comodity_SPL_Strategy_01", overlay=false)

// function of st
// [supertrend, direction] = ta.supertrend(3, 10)
// plot(direction < 0 ? supertrend : na, "Up direction", color = color.green, style=plot.style_linebr)
// plot(direction > 0 ? supertrend : na, "Down direction", color = color.red, style=plot.style_linebr)

// VWAP
// src_vwap = input(title = "Source", defval = hlc3, group="VWAP Settings")
// [_Vwap,stdv,_] = ta.vwap(src_vwap,false,1)
// plot(_Vwap, title="VWAP", color = color.rgb(0, 0, 0))


// The same on Pine Script®
pine_supertrend(factor, atrPeriod,len_ma) =>

    h= ta.sma(high,len_ma)
    l= ta.sma(low,len_ma)
    hlc_3 = (h+l)/2
    src = hlc_3
    atr = ta.atr(atrPeriod)
    upperBand = src + factor * atr
    lowerBand = src - factor * atr
    prevLowerBand = nz(lowerBand[1])
    prevUpperBand = nz(upperBand[1])

    lowerBand := lowerBand > prevLowerBand or close[1] < prevLowerBand ? lowerBand : prevLowerBand
    upperBand := upperBand < prevUpperBand or close[1] > prevUpperBand ? upperBand : prevUpperBand
    int direction = na
    float superTrend = na
    prevSuperTrend = superTrend[1]
    if na(atr[1])
        direction := 1
    else if prevSuperTrend == prevUpperBand
        direction := close > upperBand ? -1 : 1
    else
        direction := close < lowerBand ? 1 : -1
    superTrend := direction == -1 ? lowerBand : upperBand
    [superTrend, direction]
len_ma_given = input(75, title="MA_SMA_ST")
[Pine_Supertrend, pineDirection] = pine_supertrend(3, 10,len_ma_given)
// plot(pineDirection < 0 ? Pine_Supertrend : na, "Up direction", color = color.green, style=plot.style_linebr)
// plot(pineDirection > 0 ? Pine_Supertrend : na, "Down direction", color = color.red, style=plot.style_linebr)
//
// Define Supertrend parameters
atrLength = input(10, title="ATR Length")
factor = input(3.0, title="Factor")

// // Calculate Supertrend
[supertrend, direction] = ta.supertrend(factor, atrLength)

st_color = supertrend > close ? color.red : color.green
// // Plot Supertrend
// plot(supertrend, "Supertrend", st_color)
//

// BB Ploting
length = input.int(75, minval=1)
maType = input.string("SMA", "Basis MA Type", options = ["SMA", "EMA", "SMMA (RMA)", "WMA", "VWMA"])
src = input(close, title="Source")
mult = input.float(2.5, minval=0.001, maxval=50, title="StdDev")

ma(source, length, _type) =>
    switch _type
        "SMA" => ta.sma(source, length)
        "EMA" => ta.ema(source, length)
        "SMMA (RMA)" => ta.rma(source, length)
        "WMA" => ta.wma(source, length)
        "VWMA" => ta.vwma(source, length)

basis = ma(src, length, maType)
dev = mult * ta.stdev(src, length)
upper = basis + dev
lower = basis - dev
offset = input.int(0, "Offset", minval = -500, maxval = 500)
plot(basis, "Basis", color=#FF6D00, offset = offset)
p1 = plot(upper, "Upper", color=#2962FF, offset = offset)
p2 = plot(lower, "Lower", color=#2962FF, offset = offset)
fill(p1, p2, title = "Background", color=color.rgb(33, 150, 243, 95))


// h= ta.sma(high,60)
// l= ta.sma(low,60)
// c= sma(close,60)
// hlc_3 = (h+l)/2
// supertrend60 = request.security(syminfo.tickerid,  supertrend)

// // Define timeframes for signals
tf1 = input(title="Timeframe 1", defval="1")
tf2 = input(title="Timeframe 2",defval="5")
// tf3 = input(title="Timeframe 3",defval="30")


// // // Calculate Supertrend on multiple timeframes
supertrend_60 = request.security(syminfo.tickerid, tf1, Pine_Supertrend)
supertrend_5m = request.security(syminfo.tickerid, tf2, supertrend)
// supertrend3 = request.security(syminfo.tickerid, tf3, supertrend)

// // Plot Supertrend_60
st_color_60 = supertrend_60 > close ? color.rgb(210, 202, 202, 69) : color.rgb(203, 211, 203, 52)
plot(supertrend_60, "Supertrend_60", st_color_60)

// // Plot Supertrend_5m
st_color_5m = supertrend_5m > close ? color.red : color.green
plot(supertrend_5m, "Supertrend_5m", st_color_5m)


ma21 = ta.sma(close,21)
// rsi = ta.rsi(close,14)
// rsima = ta.sma(rsi,14)

// Define the Indian Standard Time (IST) offset from GMT
ist_offset = 5.5 // IST is GMT+5:30

// Define the start and end times of the trading session in IST
// start_time = timestamp("GMT", year, month, dayofmonth, 10, 0) + ist_offset * 60 * 60
// end_time = timestamp("GMT", year, month, dayofmonth, 14, 0) + ist_offset * 60 * 60
// Check if the current time is within the trading session
// in_trading_session = timenow >= start_time and timenow <= end_time

in_trading_session = not na(time(timeframe.period, "0945-1430"))
// bgcolor(inSession ? color.silver : na)
out_trading_session = not na(time(timeframe.period, "1515-1530"))
// // // Define buy and sell signals
buySignal = close>upper and close > supertrend_5m and close > supertrend_60 and close > ma21  and in_trading_session //close > supertrend and
sellSignal = close<lower and close < supertrend_5m and close < supertrend_60 and close < ma21  and in_trading_session //close < supertrend and

var bool long_position = false
var bool long_exit = false
var float long_entry_price = 0
var float short_entry_price = 0

if buySignal and not long_position
    // label.new(bar_index, na, yloc = yloc.belowbar, style = label.style_label_up, color = color.green, size = size.small)
    long_position := true
    strategy.entry("Buy",strategy.long)

long_exit := (close < supertrend_5m)
if long_position and long_exit
    // label.new(bar_index, na, yloc = yloc.belowbar, style = label.style_xcross, color = color.green, size = size.tiny)
    long_position := false
    strategy.exit("Exit","Buy",stop = close)

var bool short_position = false
var bool short_exit = false
if sellSignal and not short_position
    // label.new(bar_index, na, yloc = yloc.abovebar, style = label.style_label_down, color = color.red, size = size.small)
    short_position := true
    strategy.entry("Sell",strategy.short)

short_exit := (close > supertrend_5m)
if short_position and short_exit
    // label.new(bar_index, na, yloc = yloc.belowbar, style = label.style_xcross, color = color.red, size = size.tiny)
    short_position := false
    strategy.exit("Exit","Sell", stop = close)

if out_trading_session
    long_position := false
    strategy.exit("Exit","Buy",stop = close)
    short_position := false
    strategy.exit("Exit","Sell", stop = close)

// if long_position
//     long_entry_price := close[1] + 50//bar_index

// if short_position
//     short_entry_price := close[1] - 50//bar_index

// if (long_position and high[1] > long_entry_price)
//     label.new(bar_index, na, yloc = yloc.abovebar, style = label.style_triangledown, color = color.yellow, size = size.tiny)

// if (short_position and low[1] < short_entry_price)
//     label.new(bar_index, na, yloc = yloc.belowbar, style = label.style_triangleup, color = color.yellow, size = size.tiny)